Okteto Insights Dashboards
Okteto Insights Dashboards offer visibility into the performance and health of your applications and the infrastructure running on Okteto. These dashboards provide valuable insights into your Okteto cluster, including its overall health, trends in build and deploy times, and user activity on the platform. Analyzing this data helps you better understand and optimize both the performance of your applications and the underlying infrastructure.
Whether you’re looking to proactively identify bottlenecks, fine-tune resource allocation, or ensure that your applications are running smoothly, these dashboards provide the key data you need to make informed decisions.
Dashboards Available
Okteto provides the following dashboards out of the box:
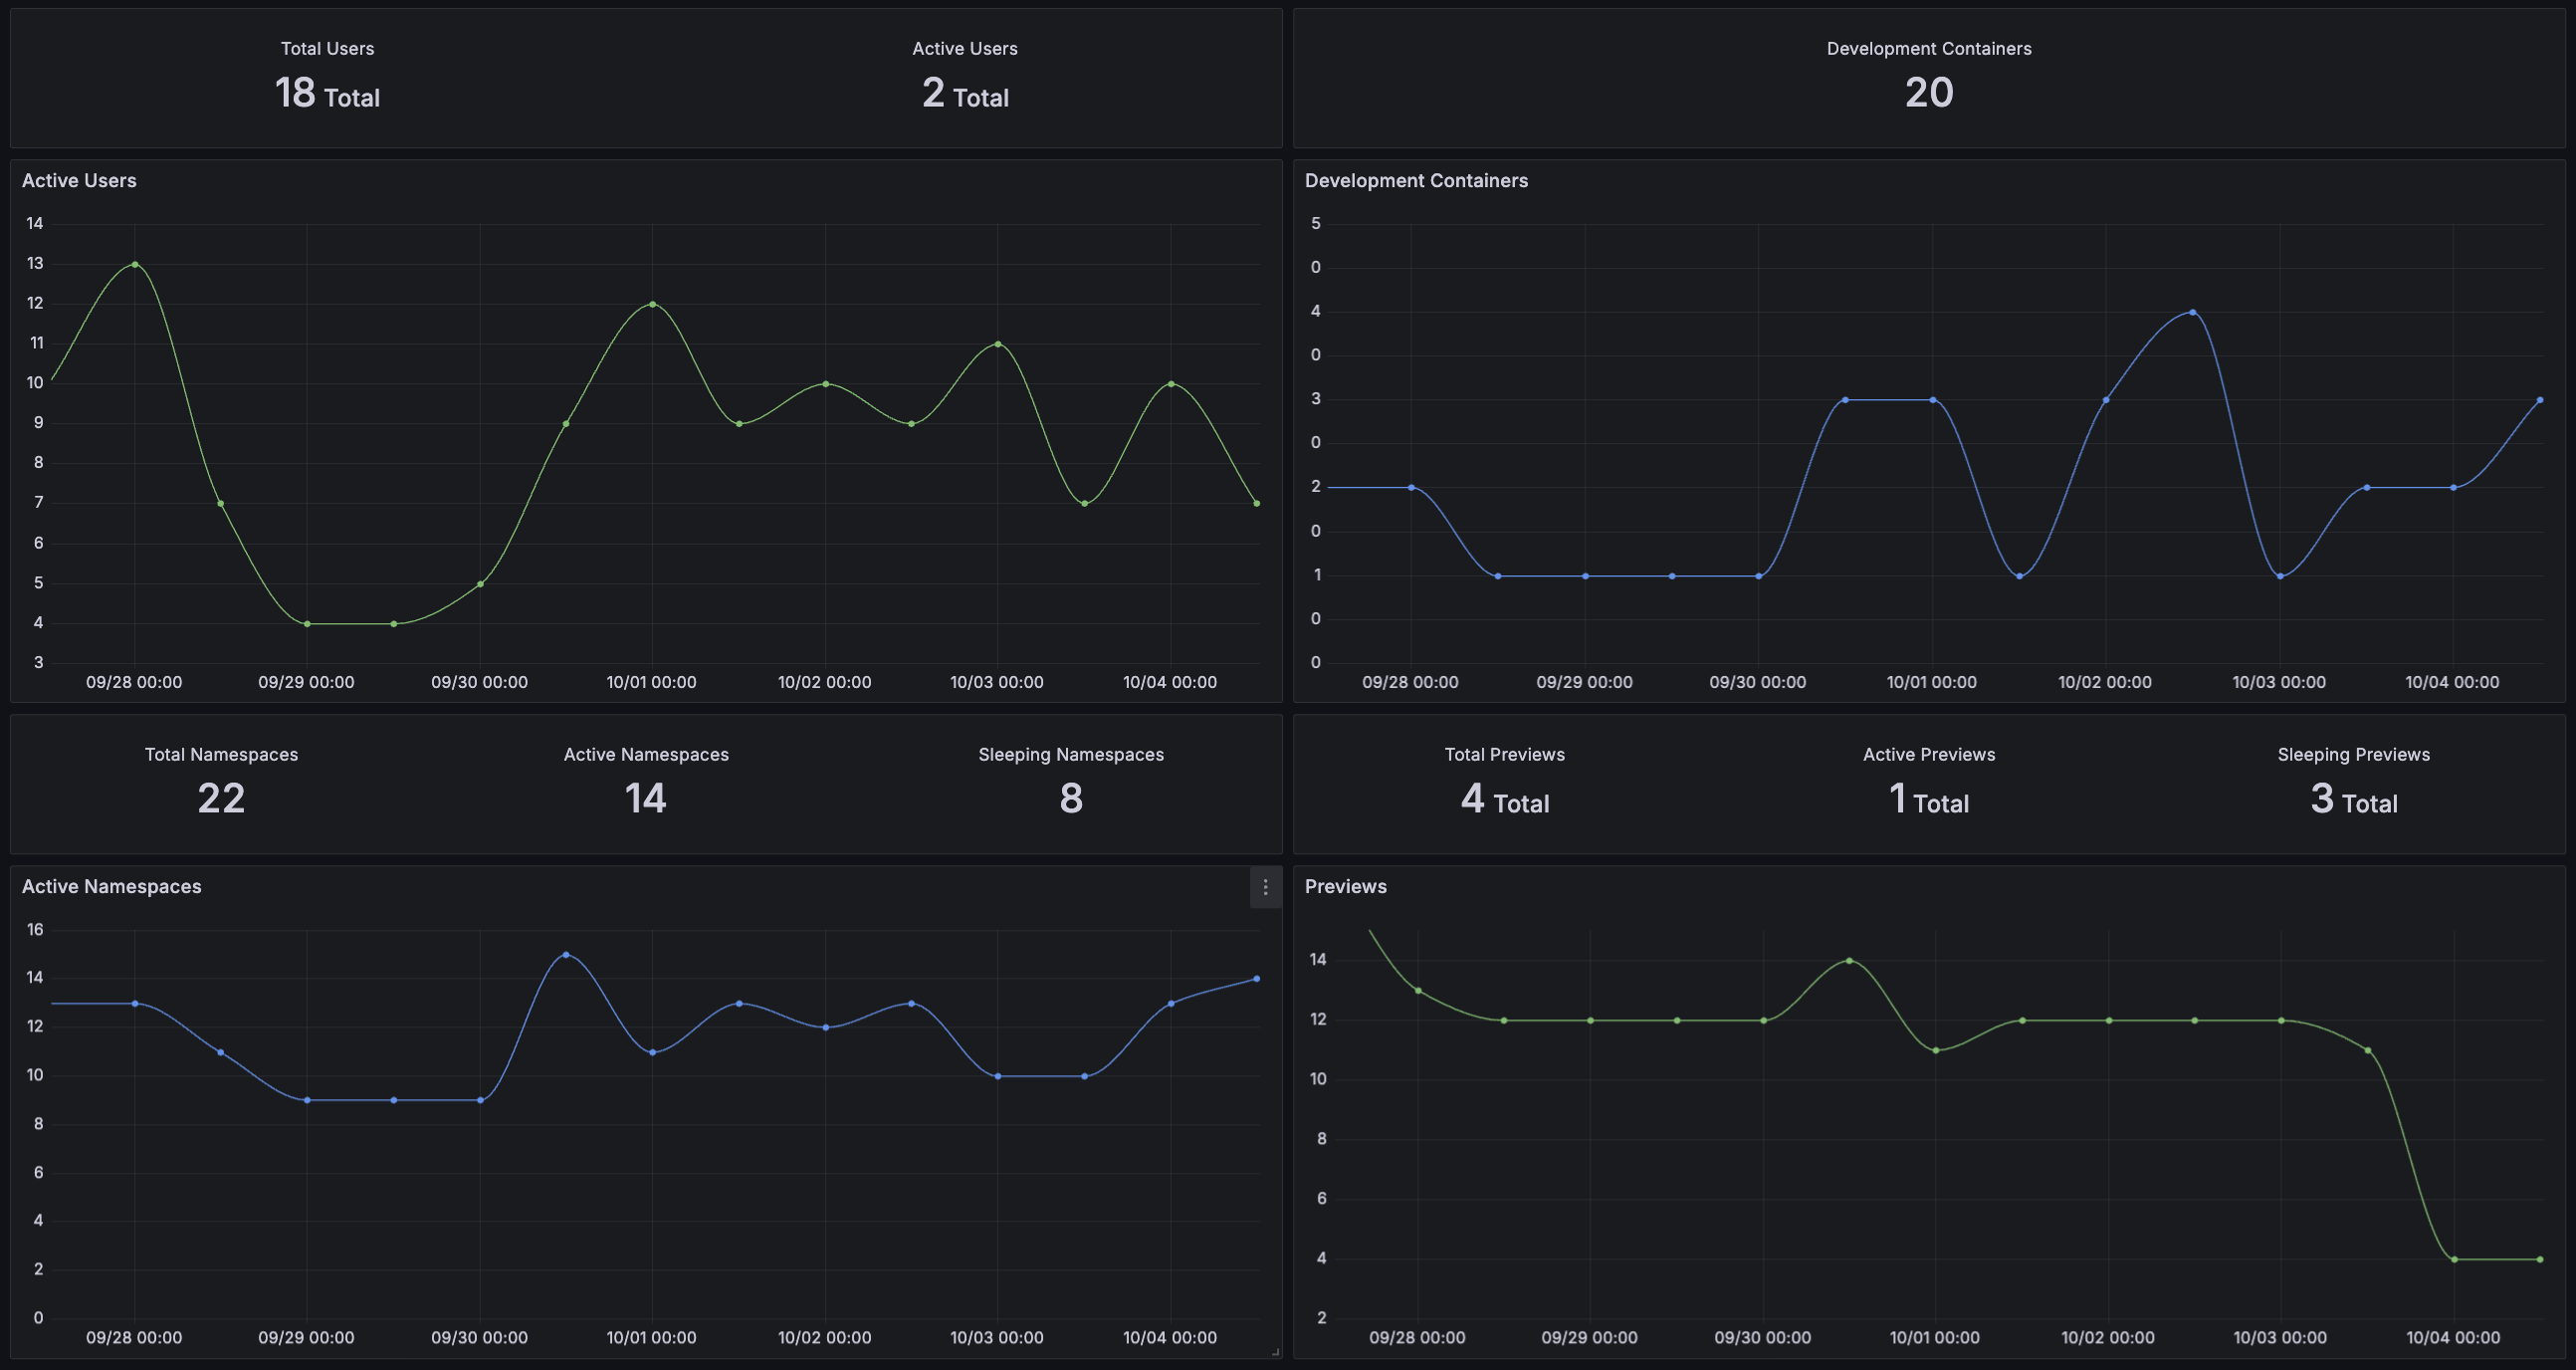
Activity Dashboard
The Activity dashboard provides metrics to help you track platform adoption and usage across your organization.
Key Metrics:
- Total active users
okteto upsessions- Active namespaces and preview environments
Build Service Dashboard
Analyzes the Okteto Build Service performance and resource utilization.
Why Use This Dashboard?
- Identify resource bottlenecks in the build service
- Monitor build concurrency and distribution across BuildKit pods
- Optimize BuildKit pod resource allocation
- Troubleshoot build performance degradation
Key Metrics:
- Total number of replicas for BuildKit pods
- Total active builds across all BuildKit pods

Key Metrics per BuildKit pod:
- Active builds per BuildKit pod
- BuildKit pod CPU and memory consumption trends
- CPU pressure and throttling indicators
- Number of disk read/write operations and I/O pressure metrics
- Available inodes to prevent build failures

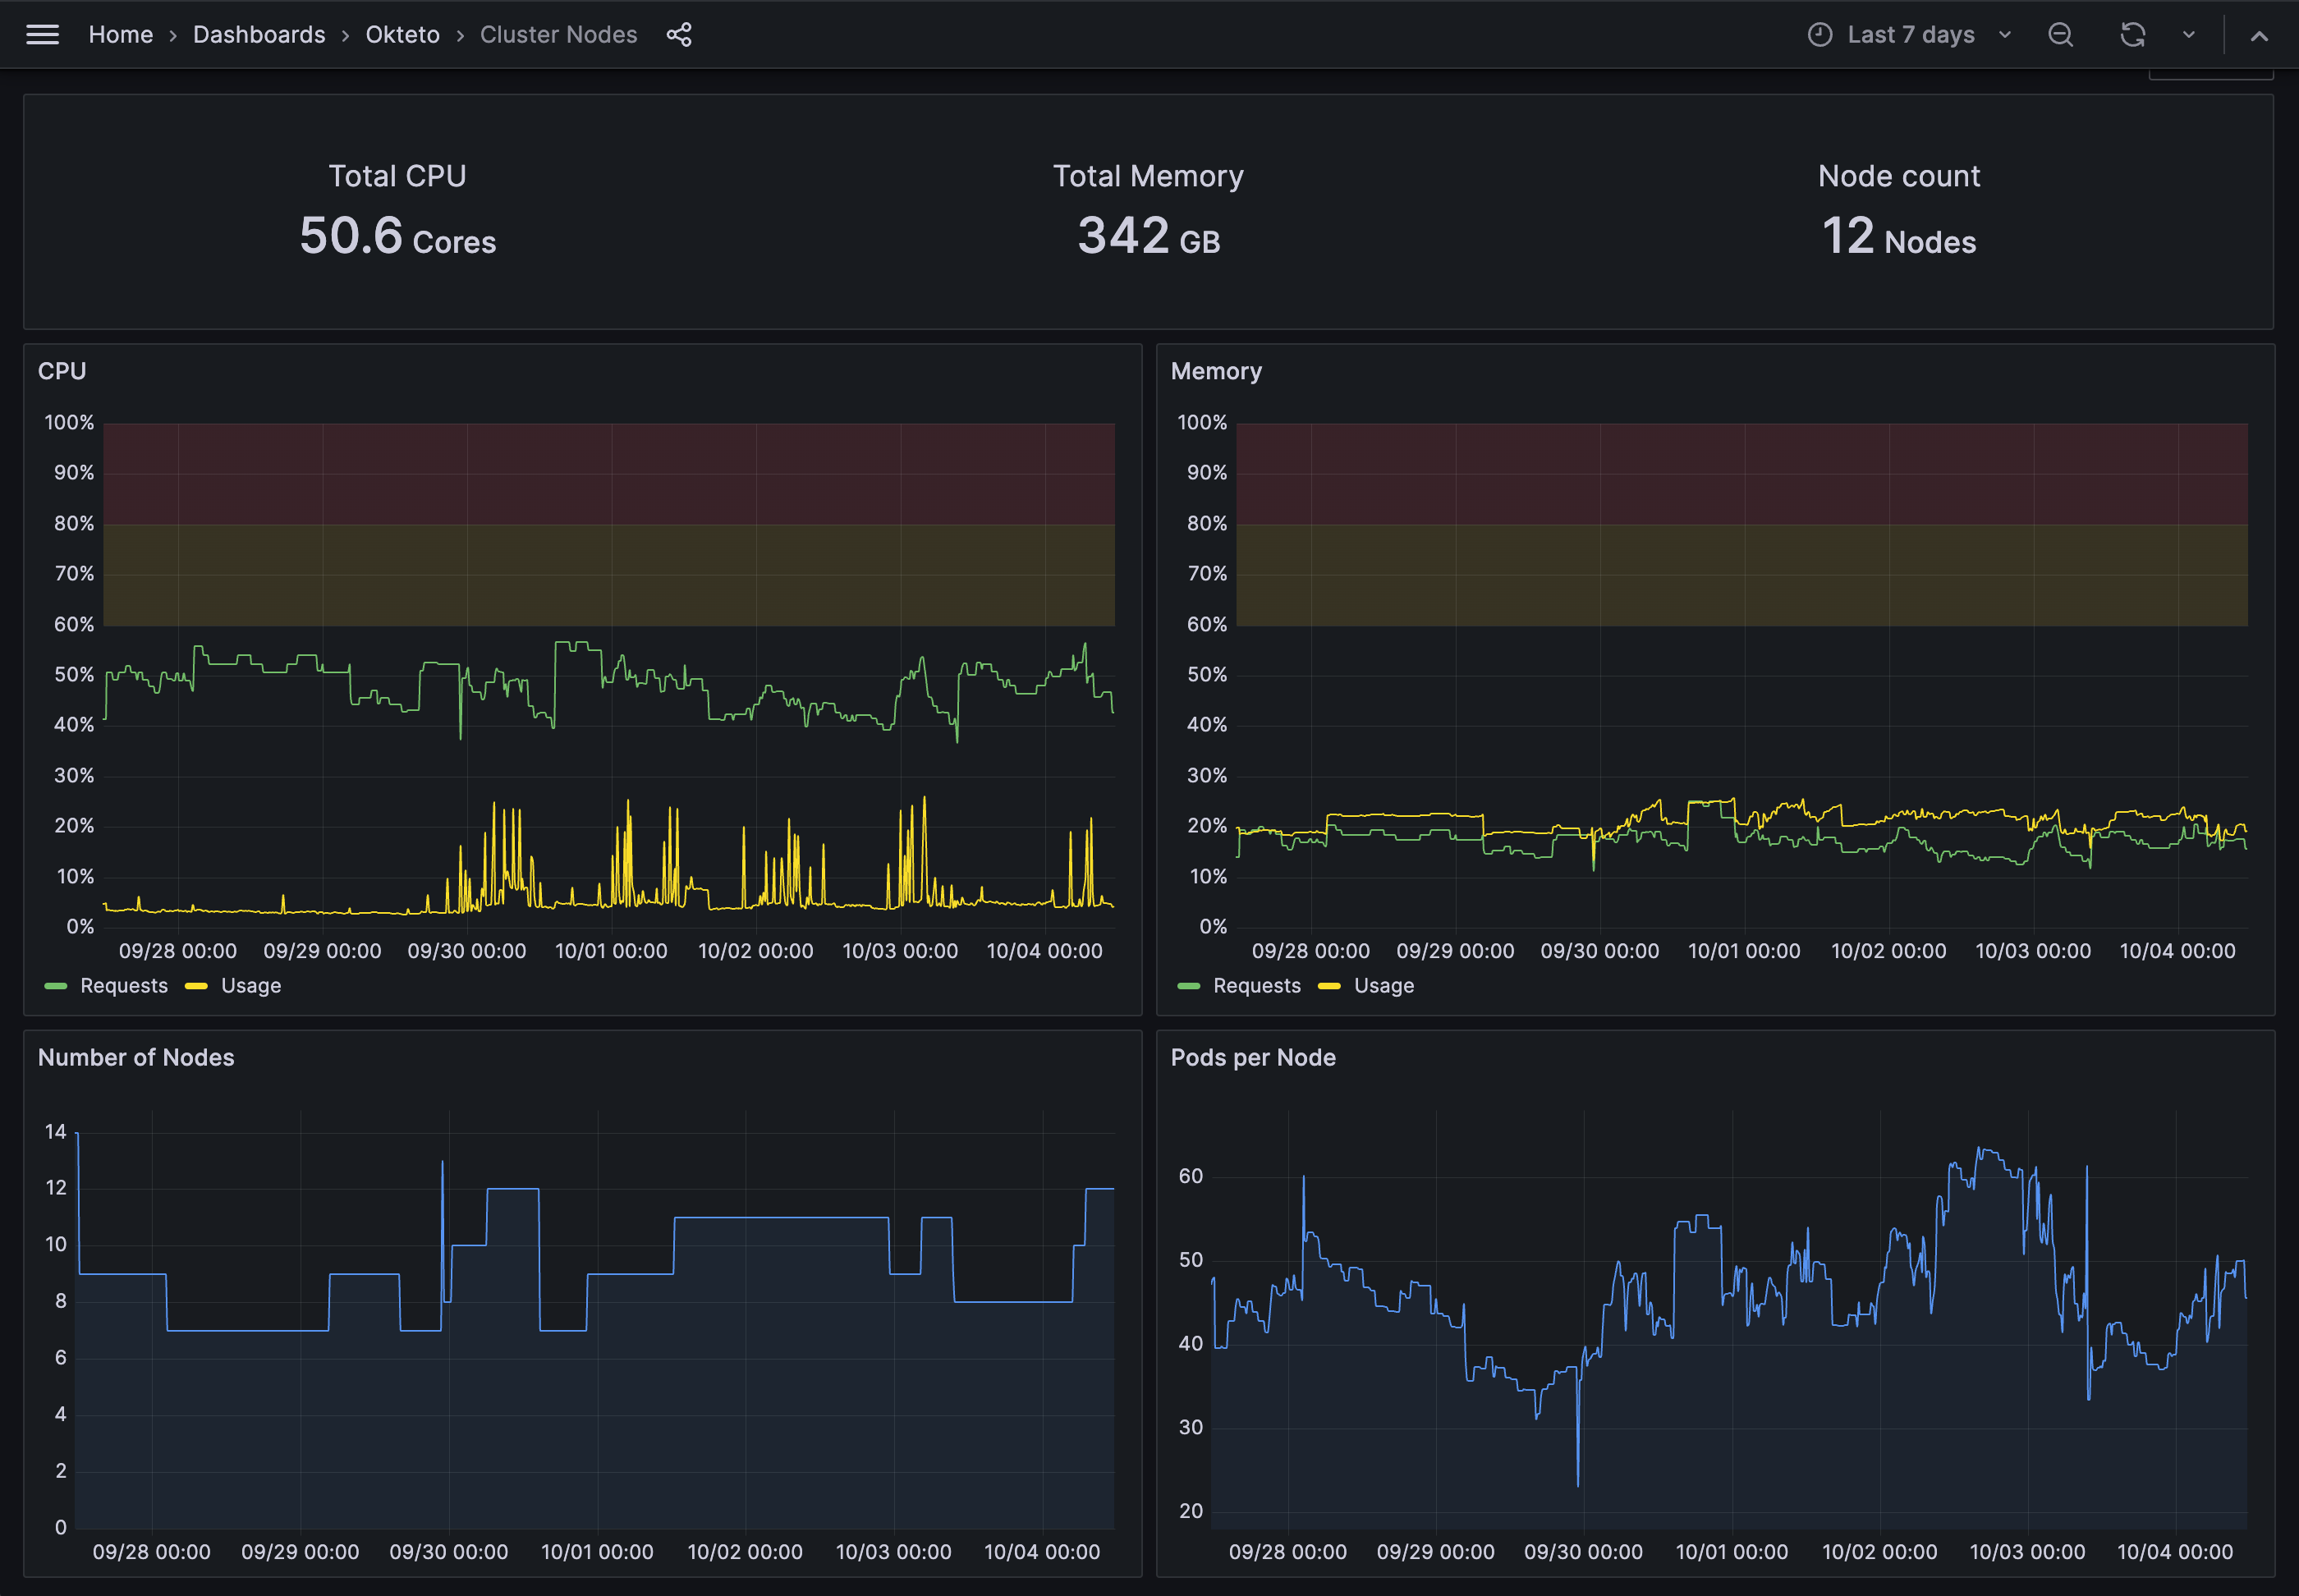
Cluster Nodes Dashboard
The Cluster Nodes dashboard provides a high-level overview of your cluster nodes' utilization, with a focus on CPU and memory usage.
It also can assist in evaluating if the CPU and memory requests of your pods align with actual usage. Pods under-utilizing their CPU/memory requests leads to wasted infrastructure, while Pods exceeding their CPU/memory requests can result in CPU throttling, pod evictions, or unbalanced workloads across the cluster.
Why Use This Dashboard?
- Detect over/under-provisioning of cluster resources
- Identify CPU/memory inefficiencies
- Ensure workload balancing across nodes
Images Dashboard
Analyzes build efficiency, duration, and error rates.
Key Metrics:
- Build duration trends
- Build success/failure rates
Filter Options:
- Development Environment – Select specific Okteto environments to display data for
- Image – Filter by container image

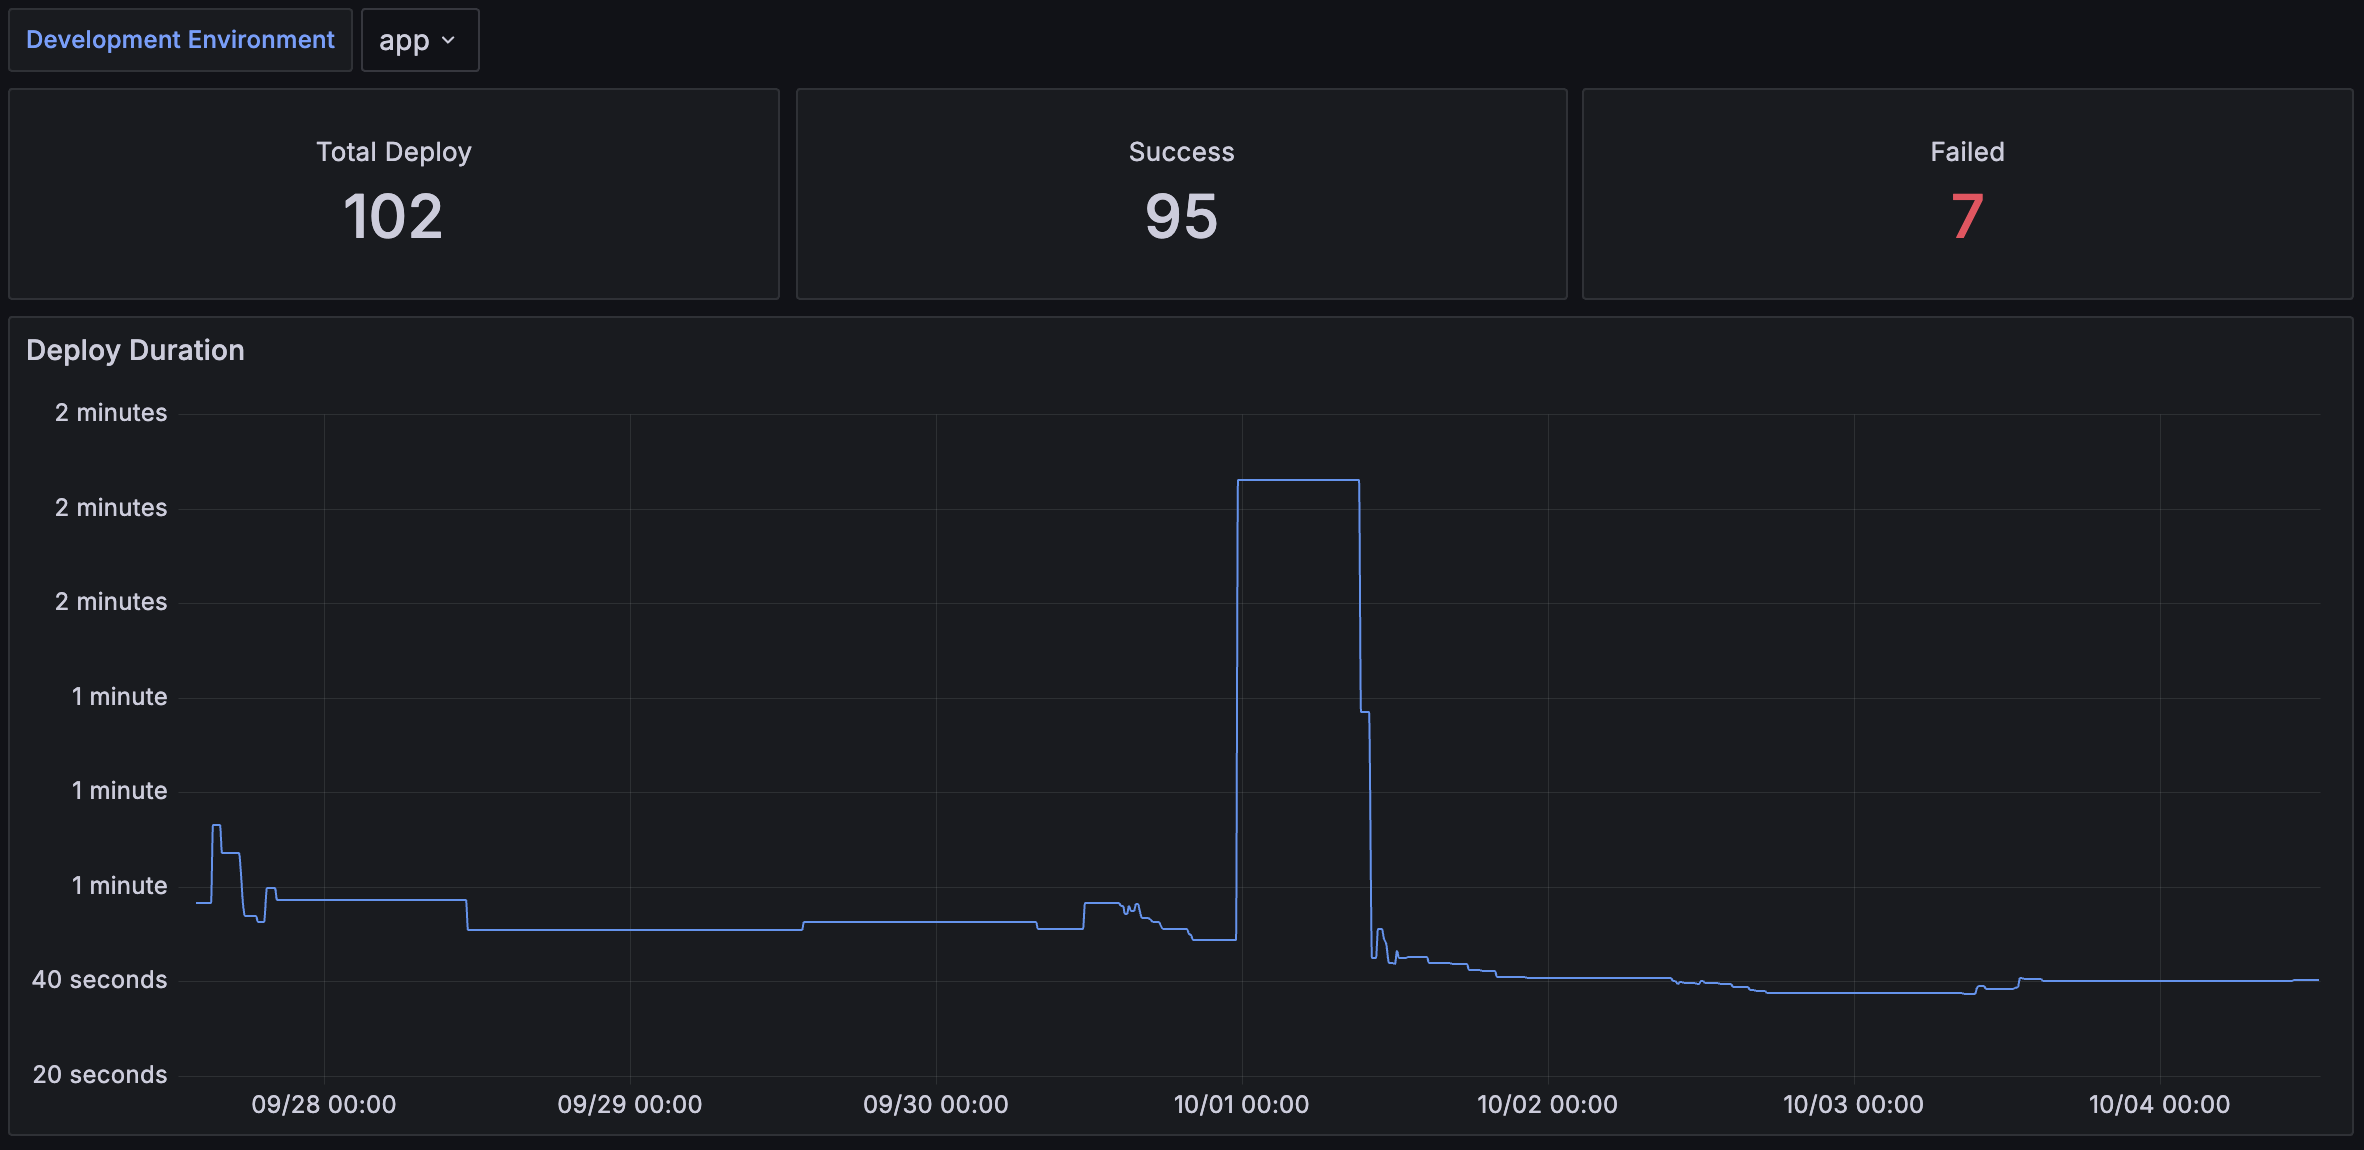
Deploy Dashboard
The Deploy dashboard helps you analyze the evolution of application deployments, focusing on both duration and error rates.
Key Metrics:
- Deployment duration
- Error rate trends
Filter Options:
- Development Environment – Select specific Okteto environments to display data for
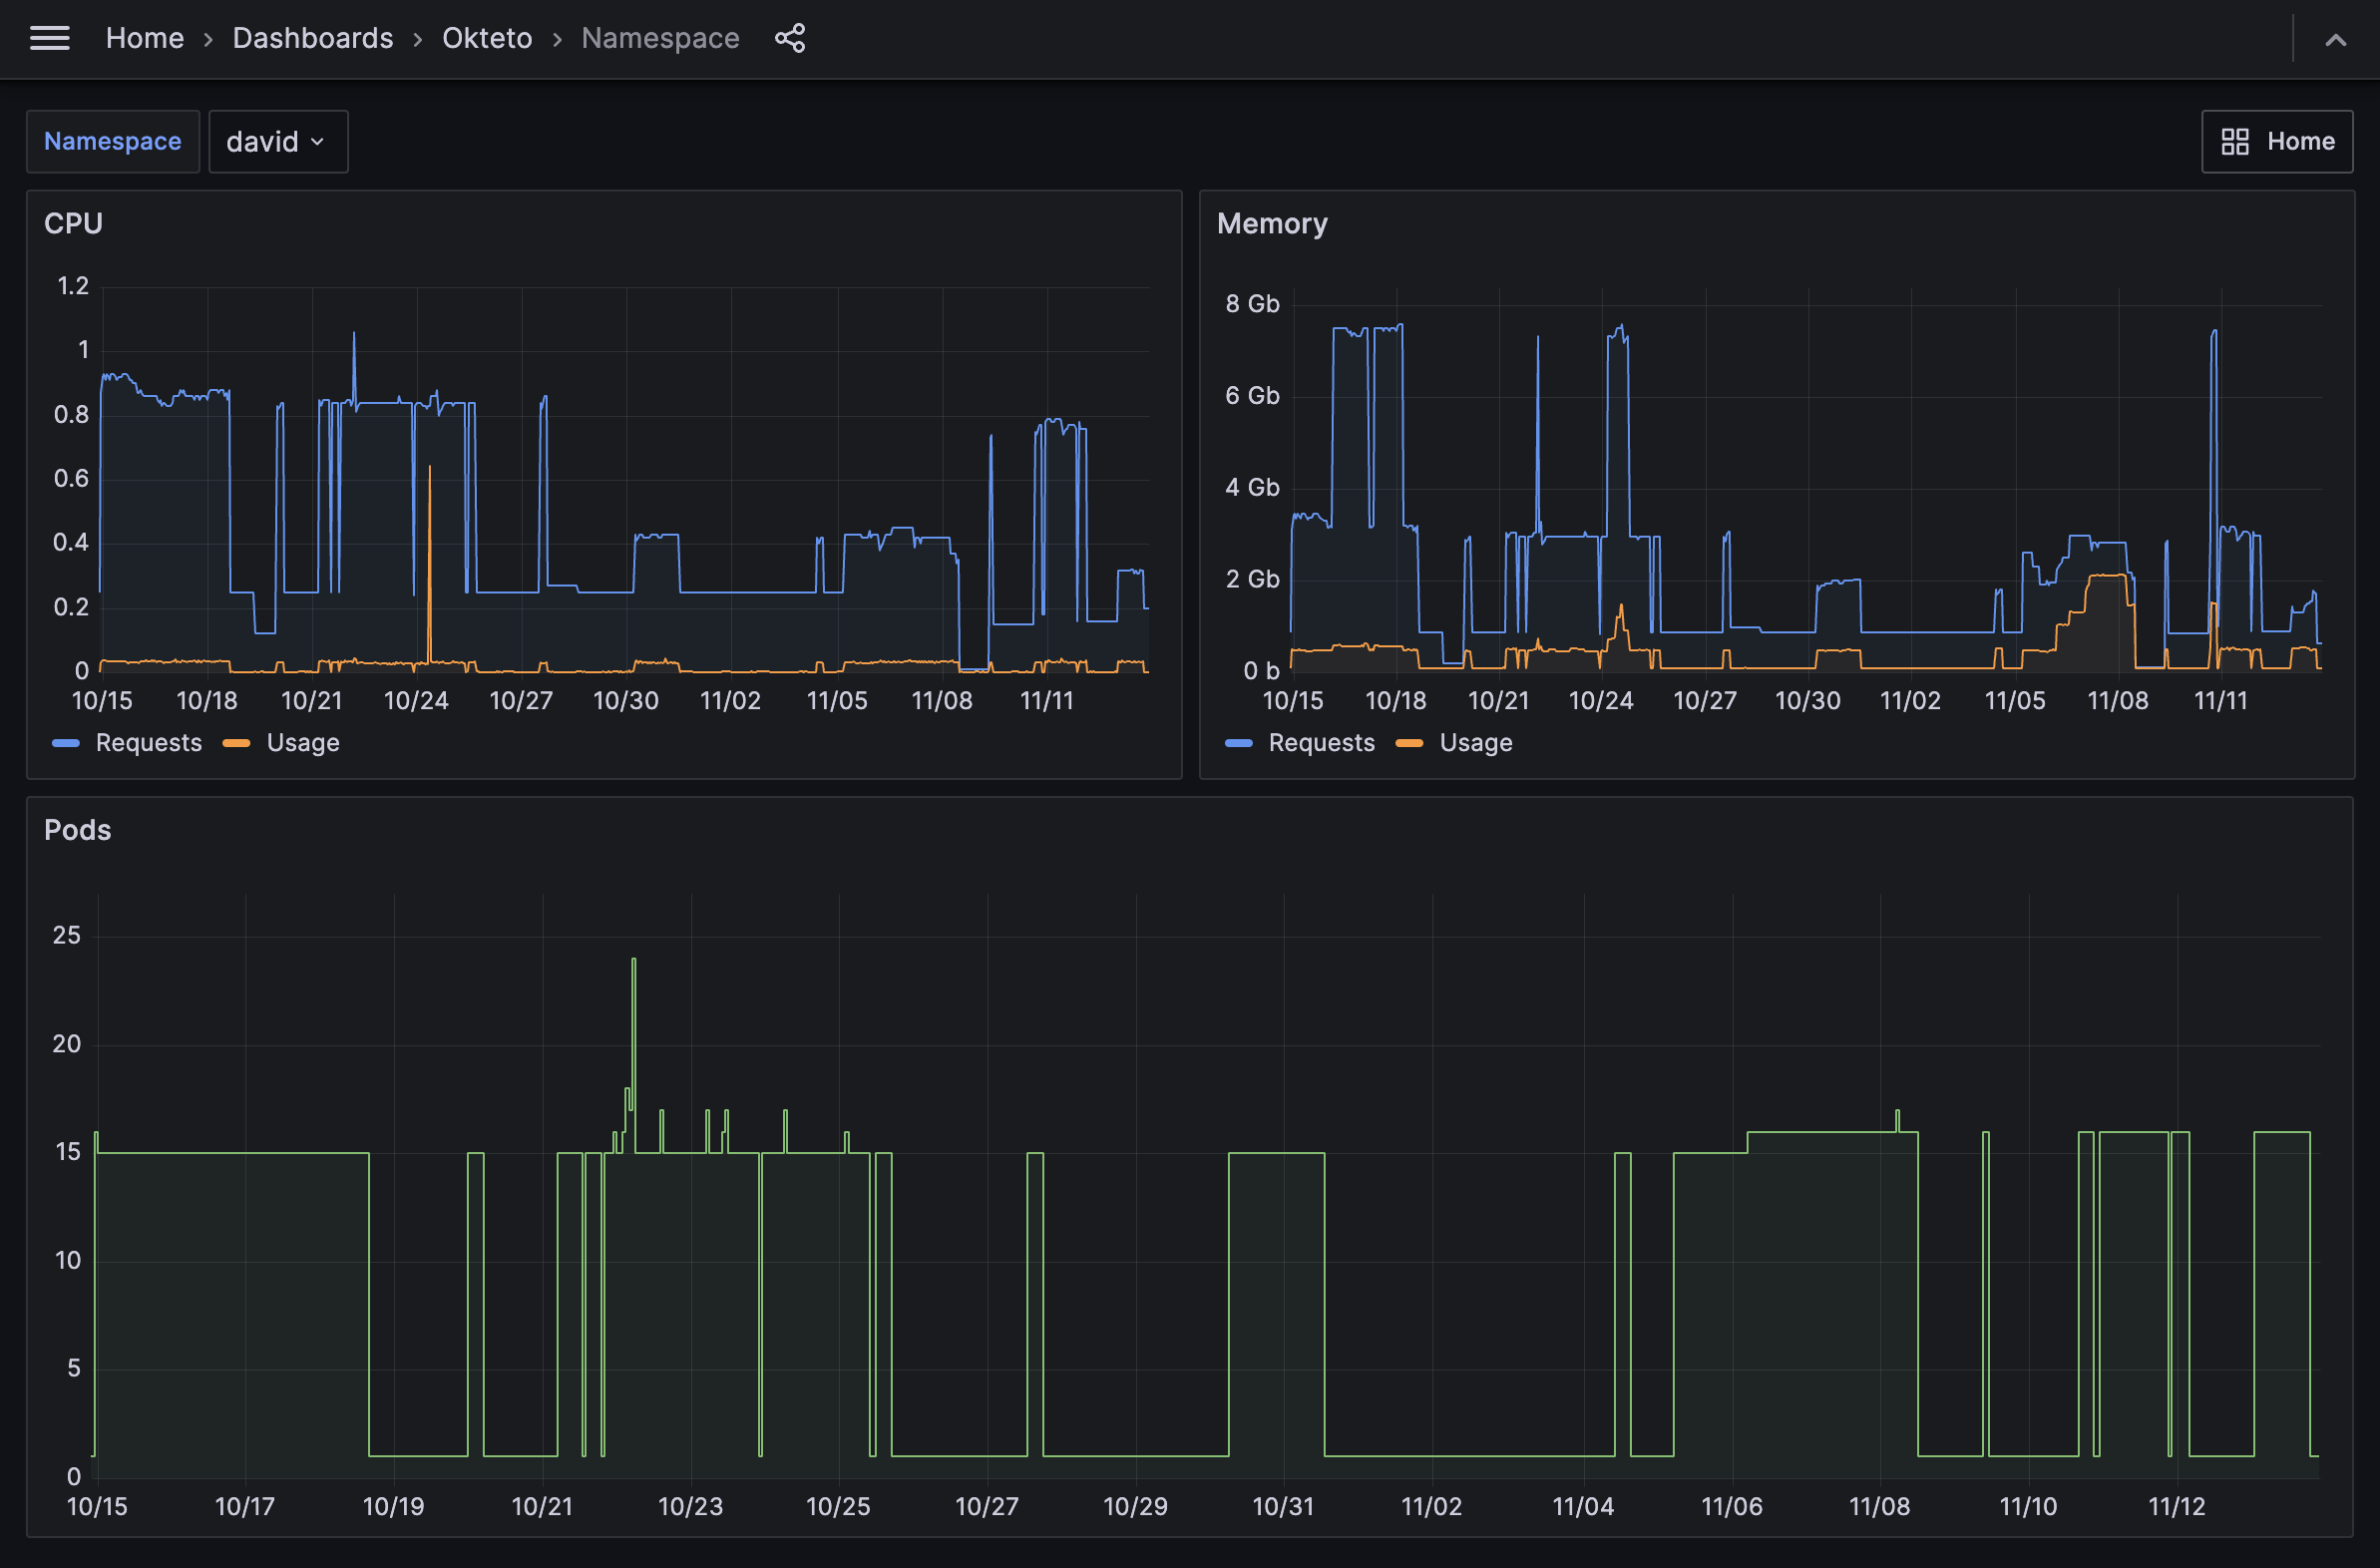
Namespace Dashboard
The Namespace Dashboard provides an overview of the CPU and Memory resources consumed per Namespace, helping you monitor and optimize the performance of specific applications or Development Environments.
CPU and Memory Utilization The graphs track CPU and memory usage, showing:
- CPU Requests vs. Usage: This shows the trends between requested CPU resources and actual usage. Monitoring discrepancies between the two can help identify over-allocated or under-utilized resources.
- Memory Requests vs. Usage: This shows the trends between memory requests and actual memory consumption. Understanding these trends helps optimize memory allocation.
Pro Tip: Use the Resource Manager to automate resource balancing.
Pods The Pods section displays the number of Pods active in the namespace over time, helping you correlate spikes in resource usage with changes in the number of running Pods.
Filter Options
- Namespace: The name of the Okteto Namespace to display specific data for
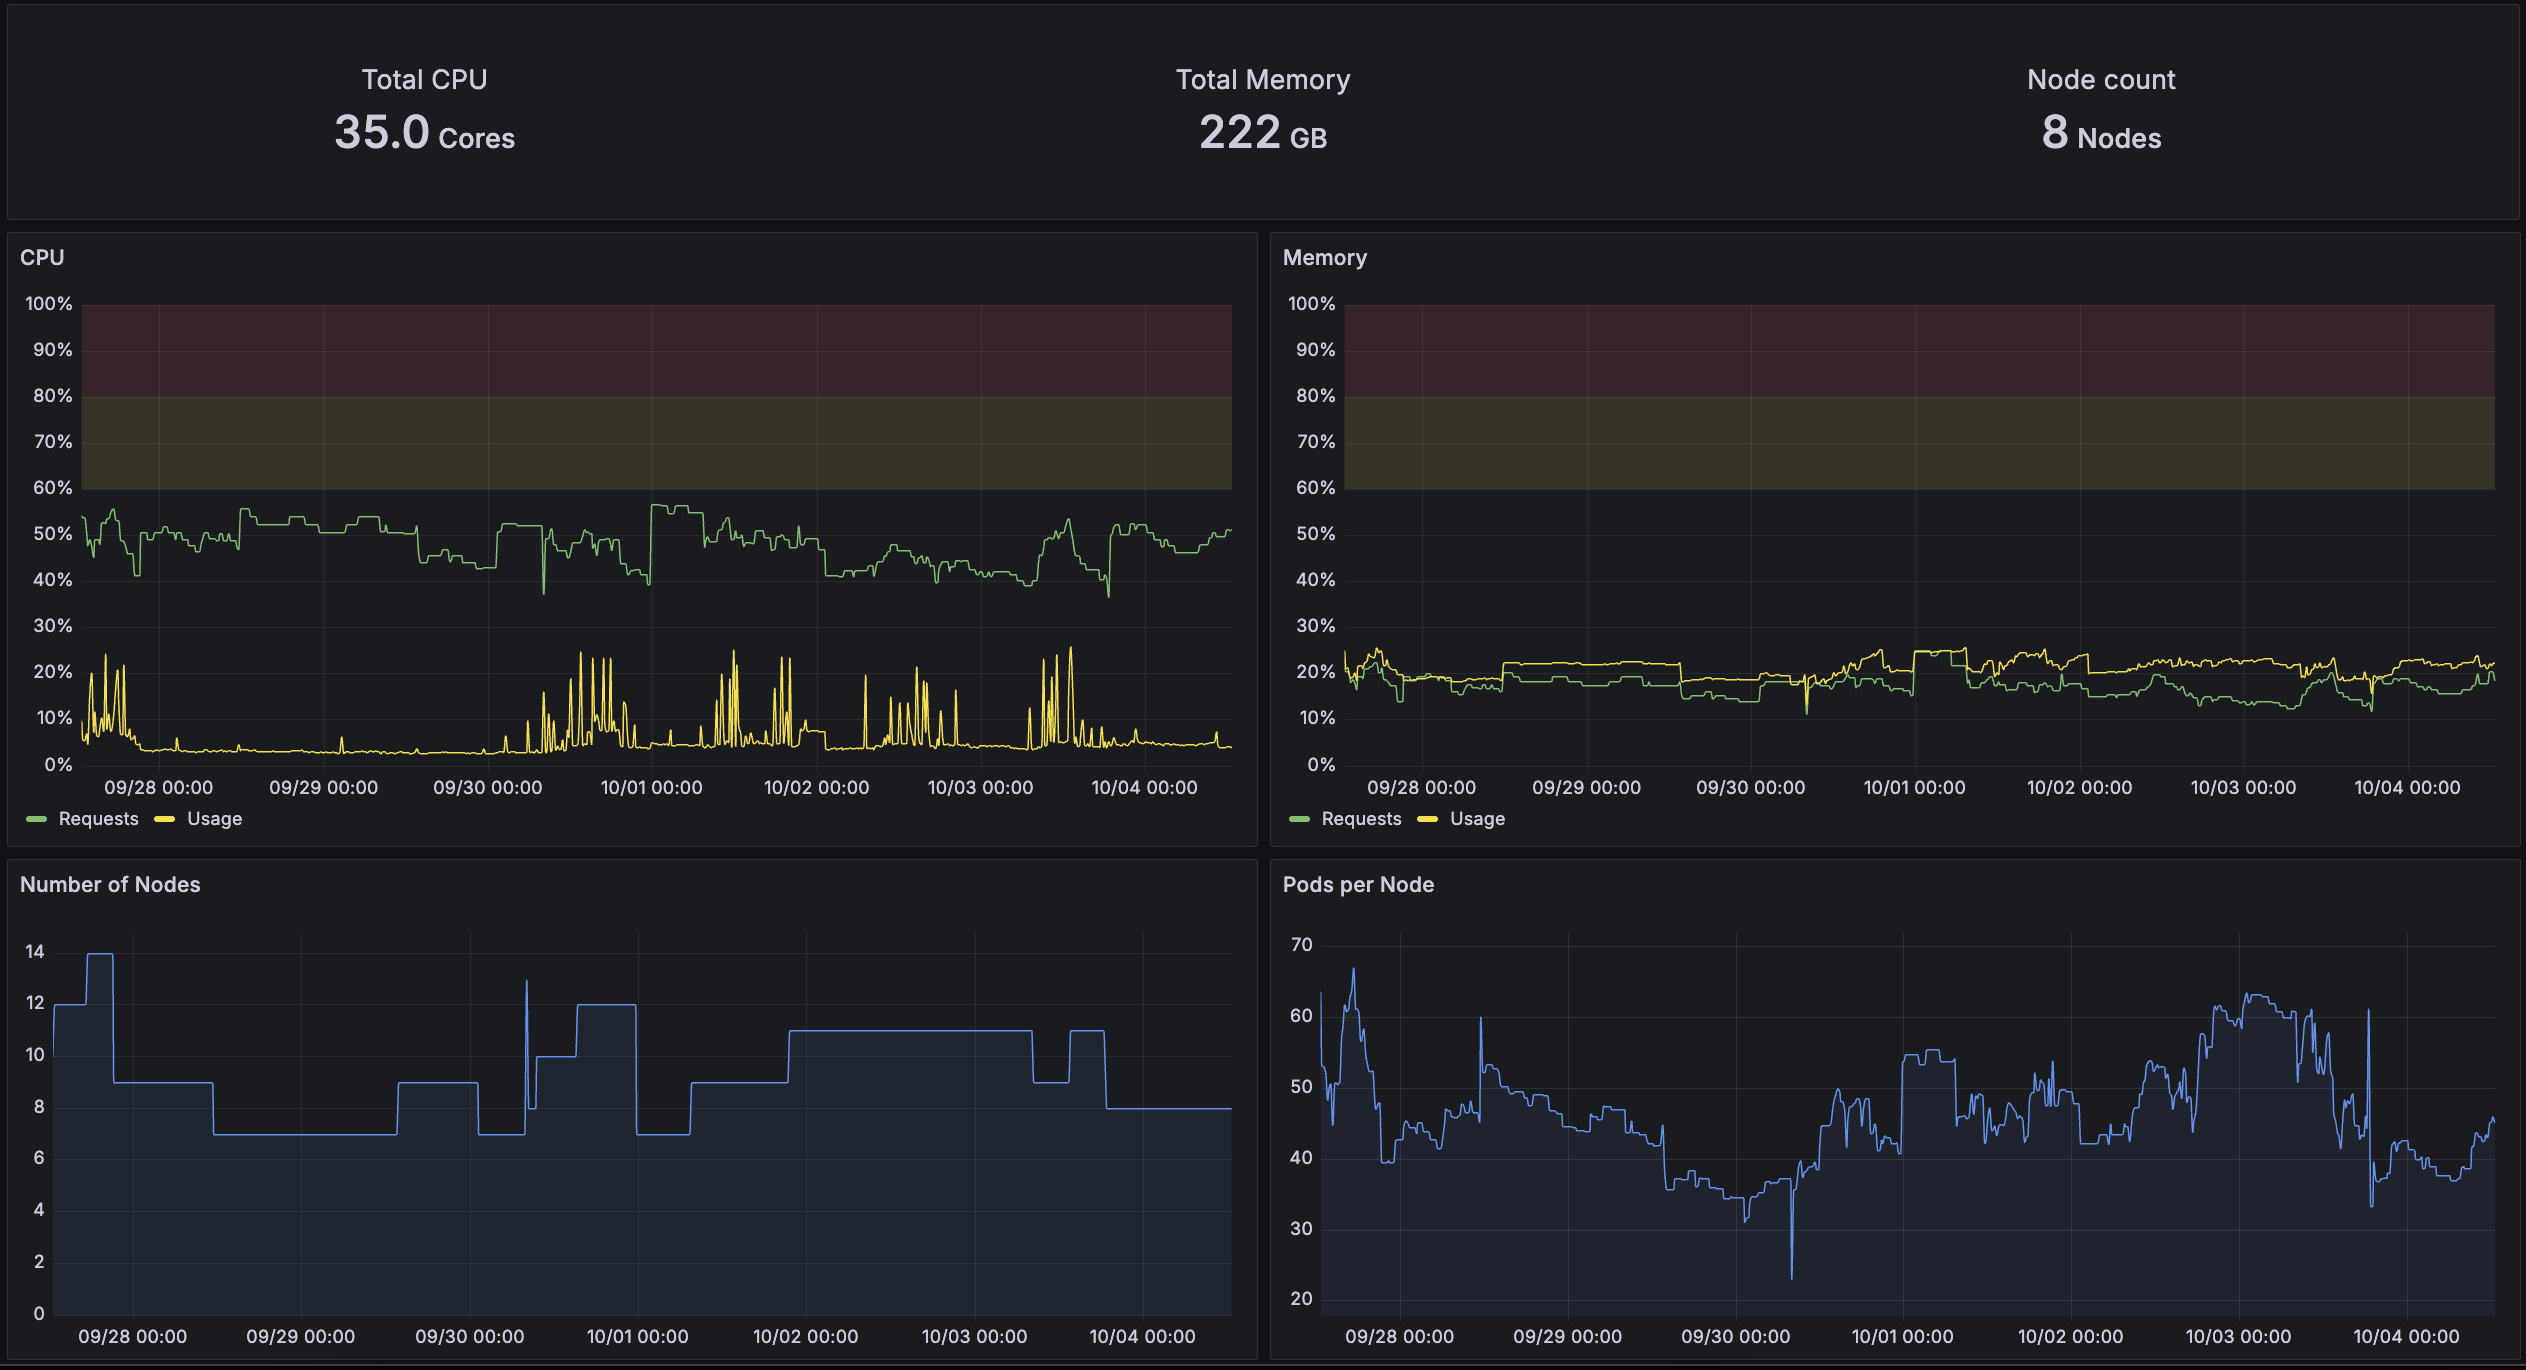
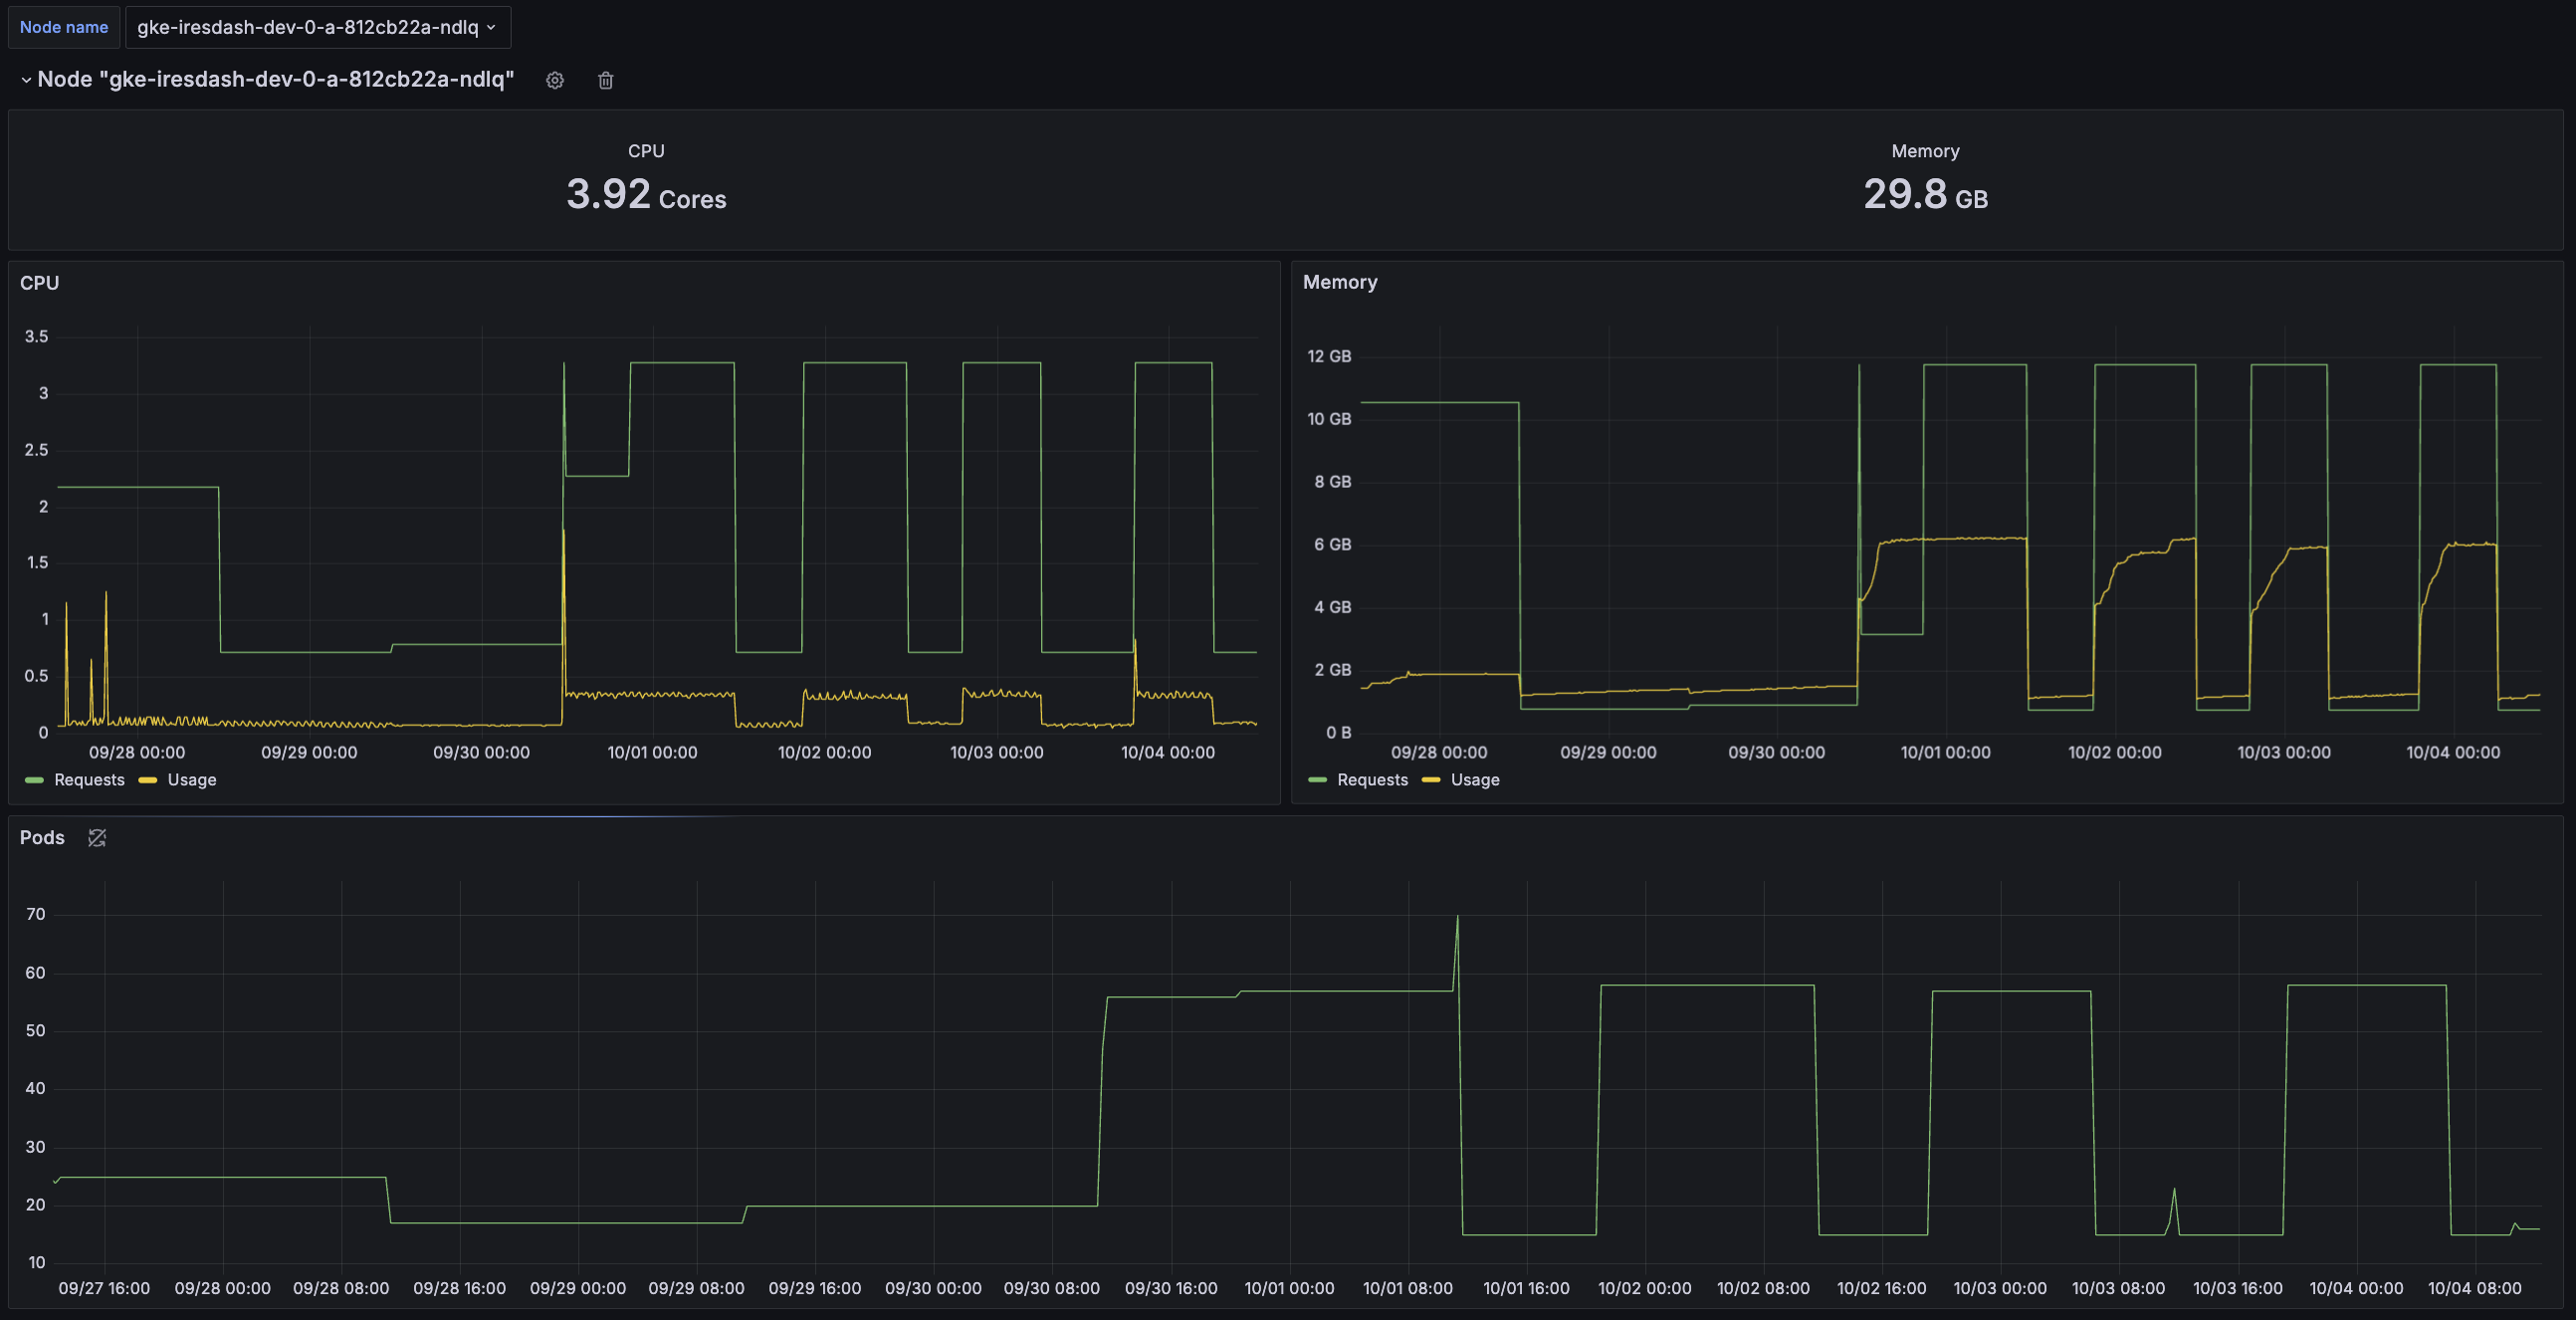
Nodes Dashboard
The Nodes dashboard offers a high-level overview of each cluster node's utilization, focusing on CPU and memory usage.
Key Use Cases:
- Troubleshoot performance issues on specific nodes
- Validate workload distribution across nodes
Filter Options
- Node Name: The name of the Kubernetes node to display specific data for
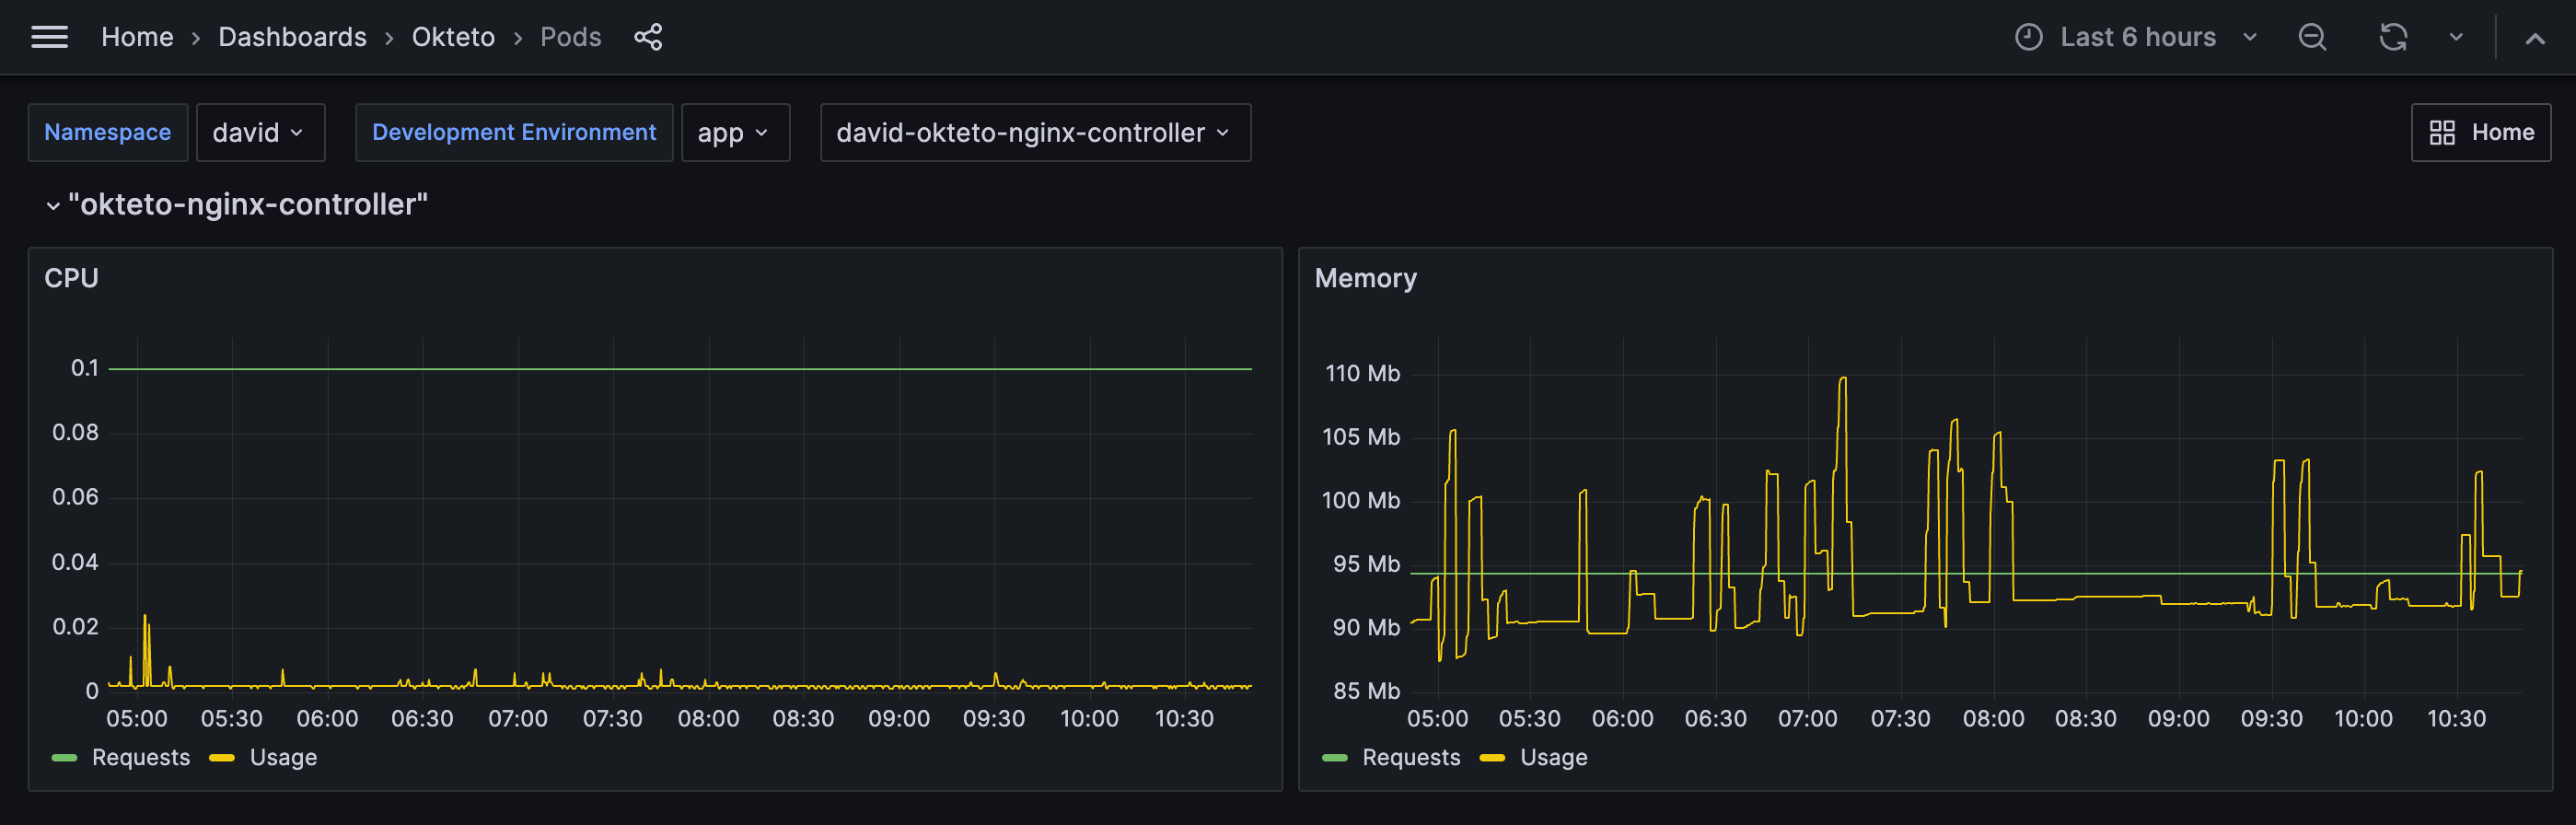
Pods Dashboard
The Pods dashboard shows usage information related to each Kubernetes Pod.
Use This Dashboard To:
- Monitor CPU/memory consumption at the pod level
- Detect performance issues like memory leaks
Filter Options:
- Namespace: The name of the Okteto Namespace to display specific data for, filtered by the selected Development Environment
- Development Environment: The specific Okteto Development environment to display data for
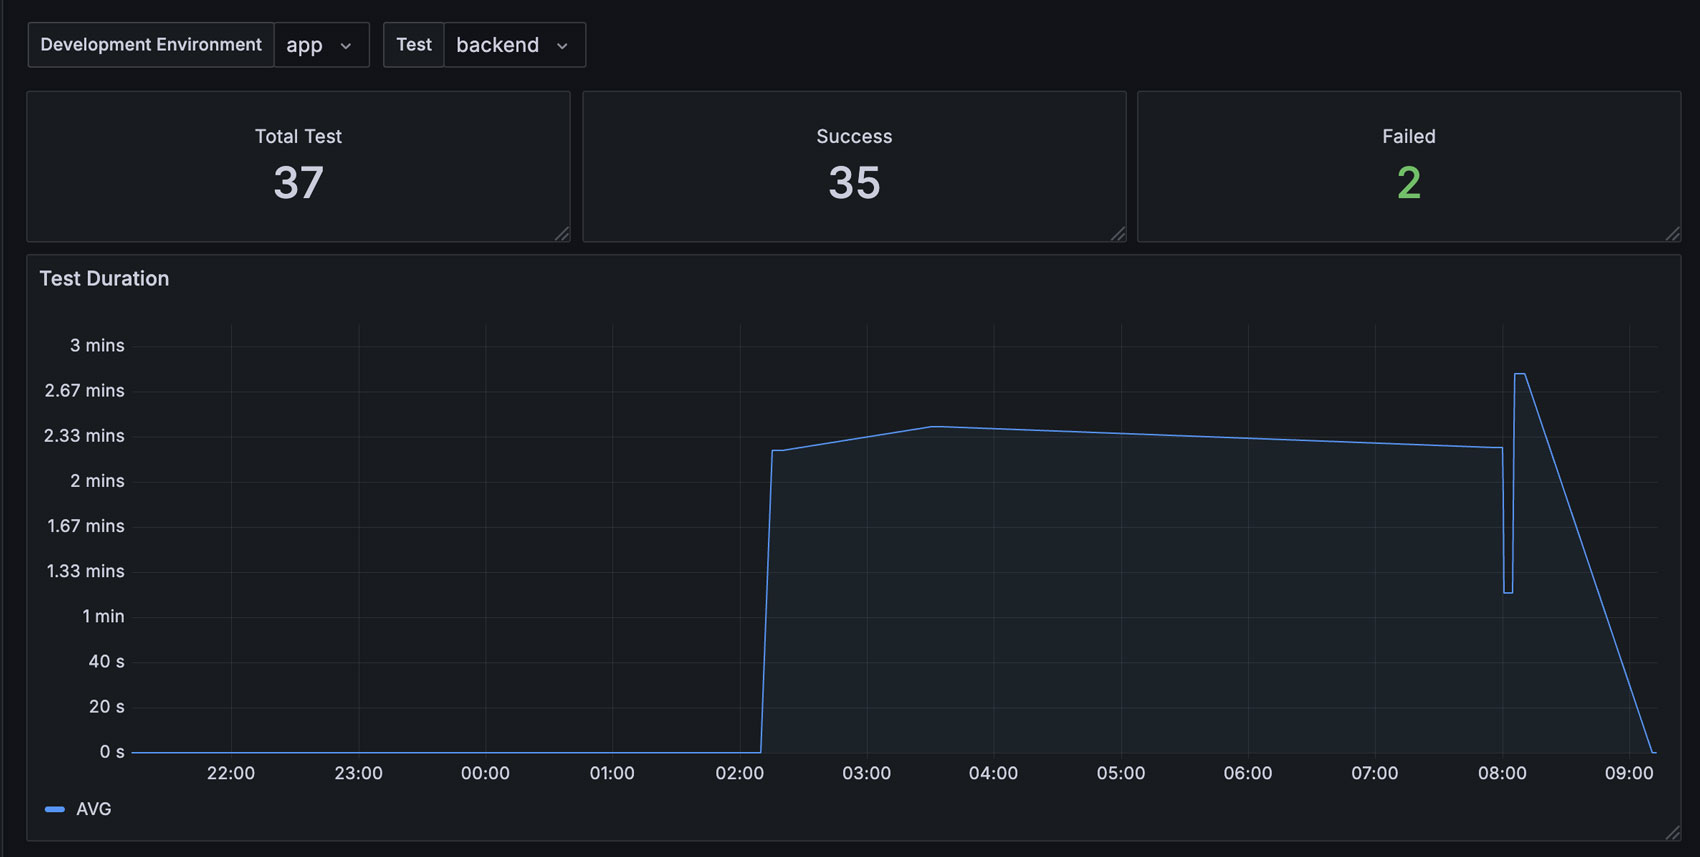
Test Dashboard
The Test dashboard helps you analyze the evolution of Okteto Test runs, focusing on the average duration it takes for a test to complete successfully.
Key Metrics:
- Average test duration
- Success/failure trends
Filter Options
- Development Environment: The specific Okteto Development environment to display data for
- Test to specify the name of the Test Container to display data for
Consuming Insights metrics from other tools
You can consume Okteto Insights metrics through external tools.
Check out our Okteto Insights Admin Documentation for more details.
For a deeper look at how these dashboards are built, explore our open-source repository and learn about the data available.