Okteto Insights Dashboards
Okteto Insights Dashboards offer visibility into the performance and health of your applications and the infrastructure running on Okteto. These dashboards provide valuable insights into your Okteto cluster, including its overall health, trends in build and deploy times, and user activity on the platform. Analyzing this data helps you better understand and optimize both the performance of your applications and the underlying infrastructure.
Whether you’re looking to proactively identify bottlenecks, fine-tune resource allocation, or ensure that your applications are running smoothly, these dashboards provide the key data you need to make informed decisions.
Dashboards Available
Okteto integrates the following dashboards out of the box:
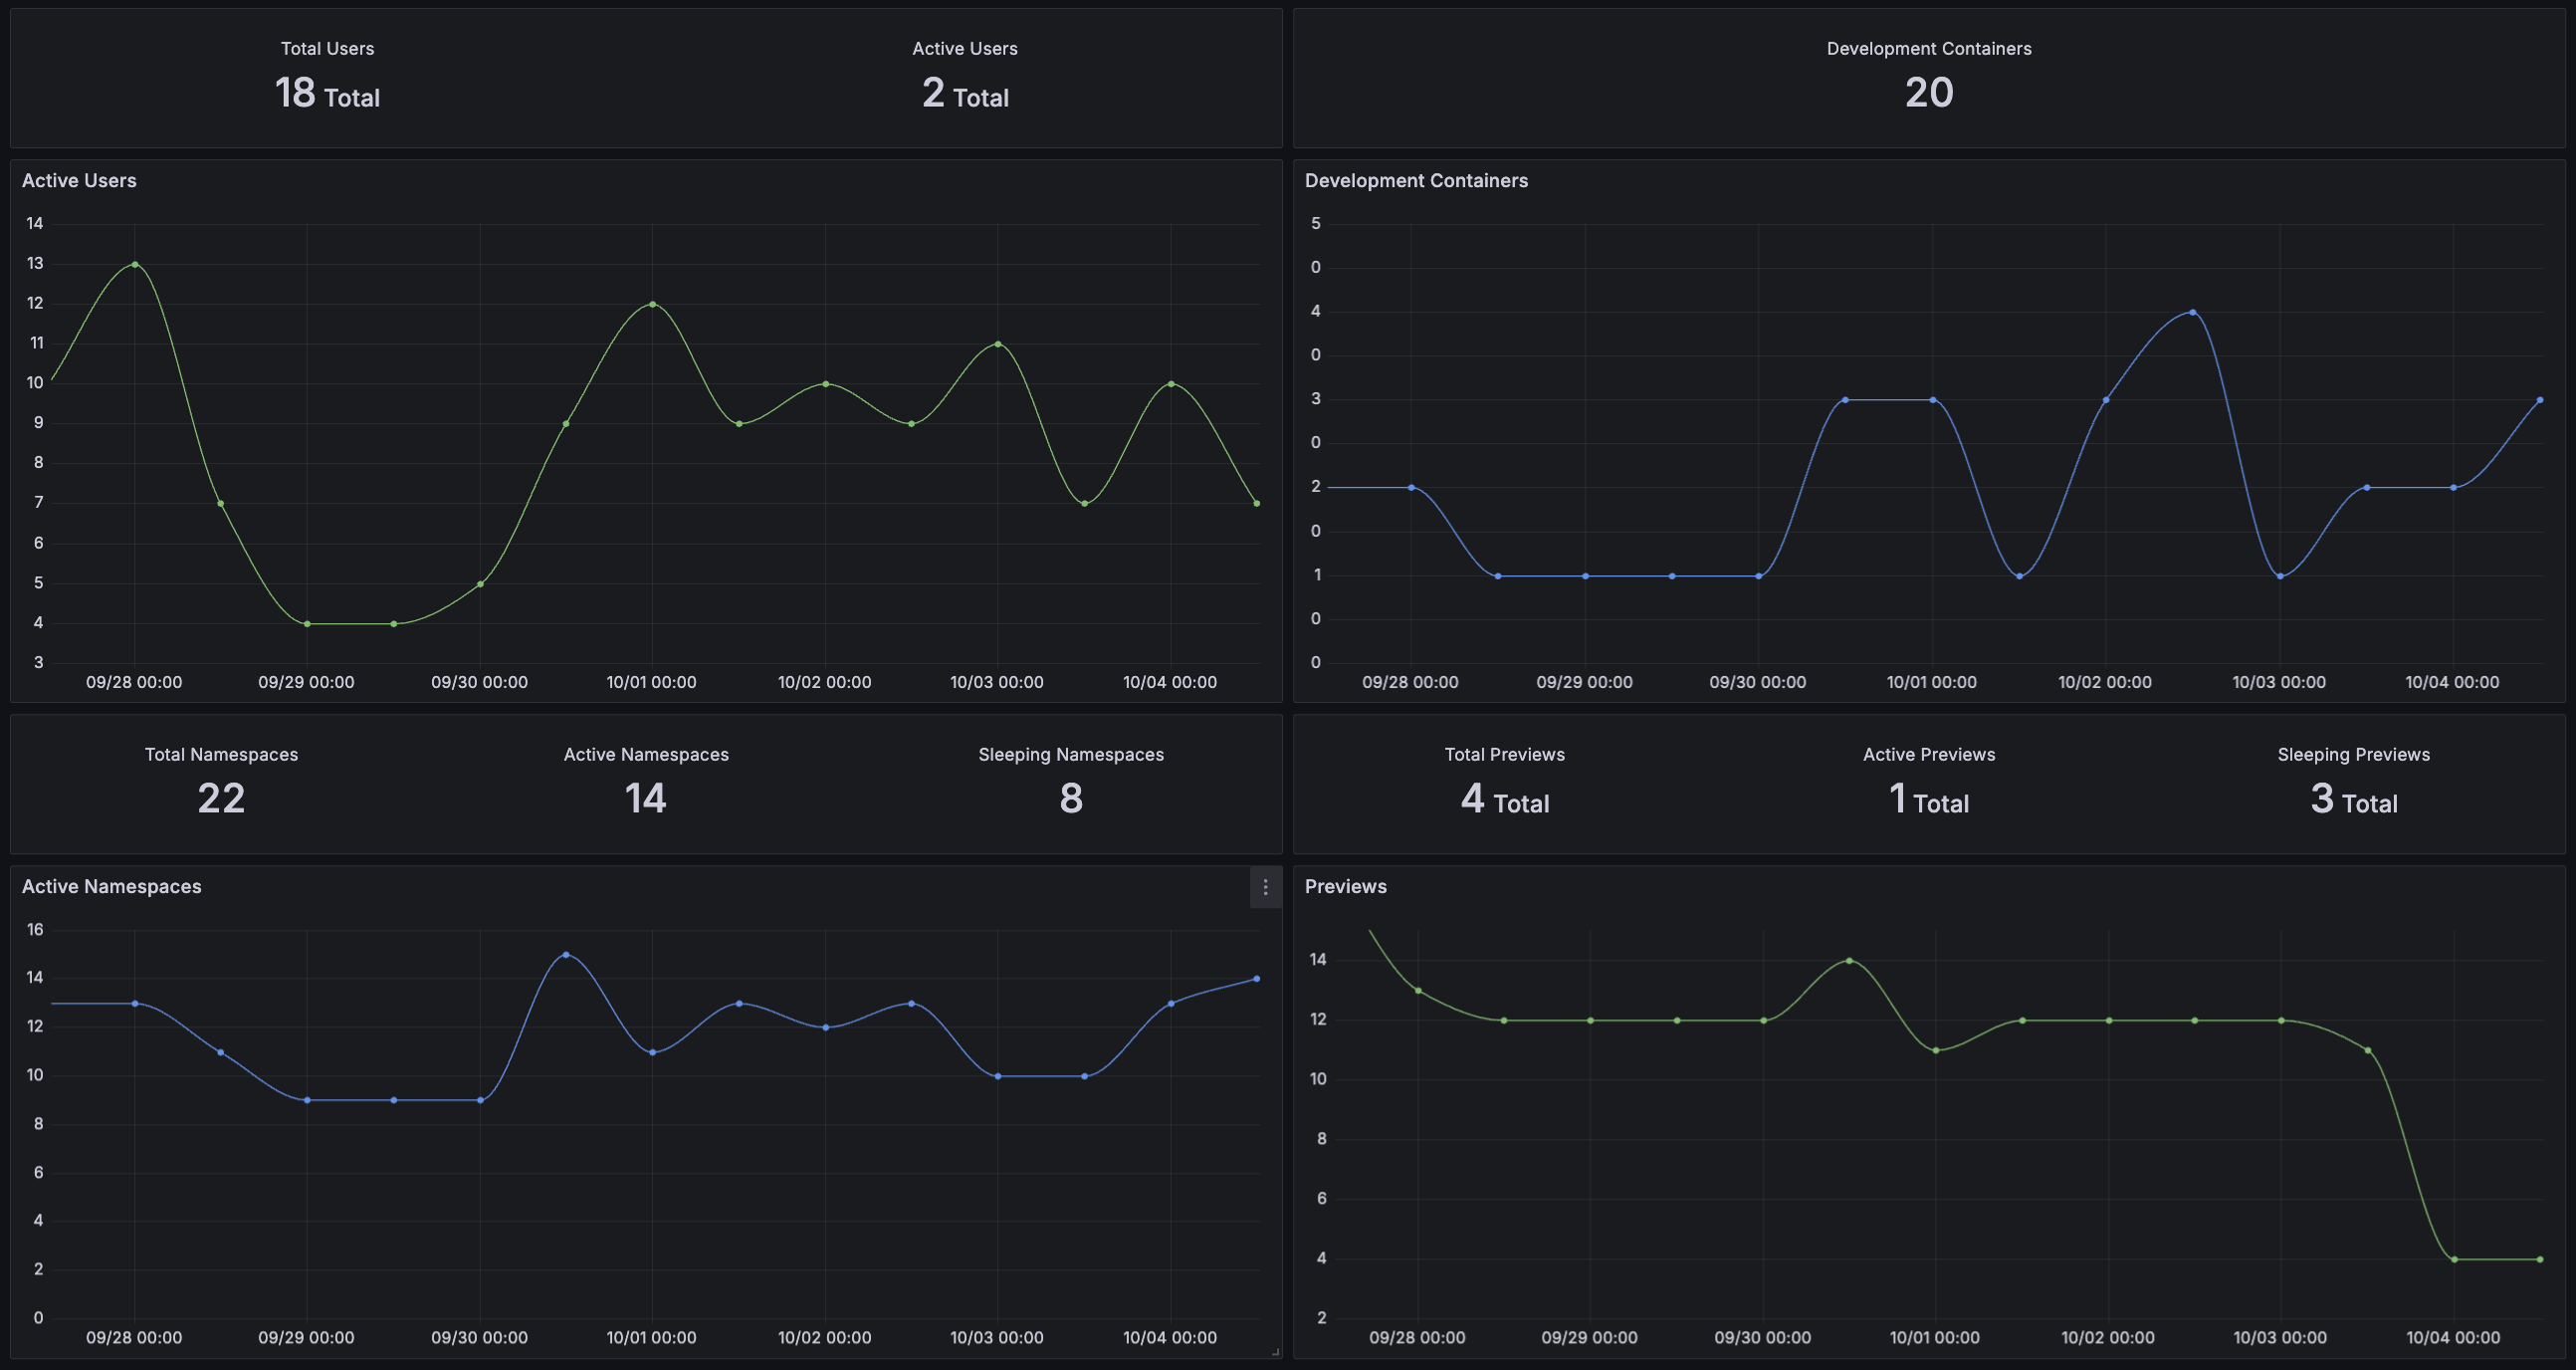
Activity Dashboard
The Activity dashboard provides metrics to help you track platform adoption and usage across your organization.
It shows total active users, okteto up sessions, active namespaces and active previews over time.
Build Dashboard
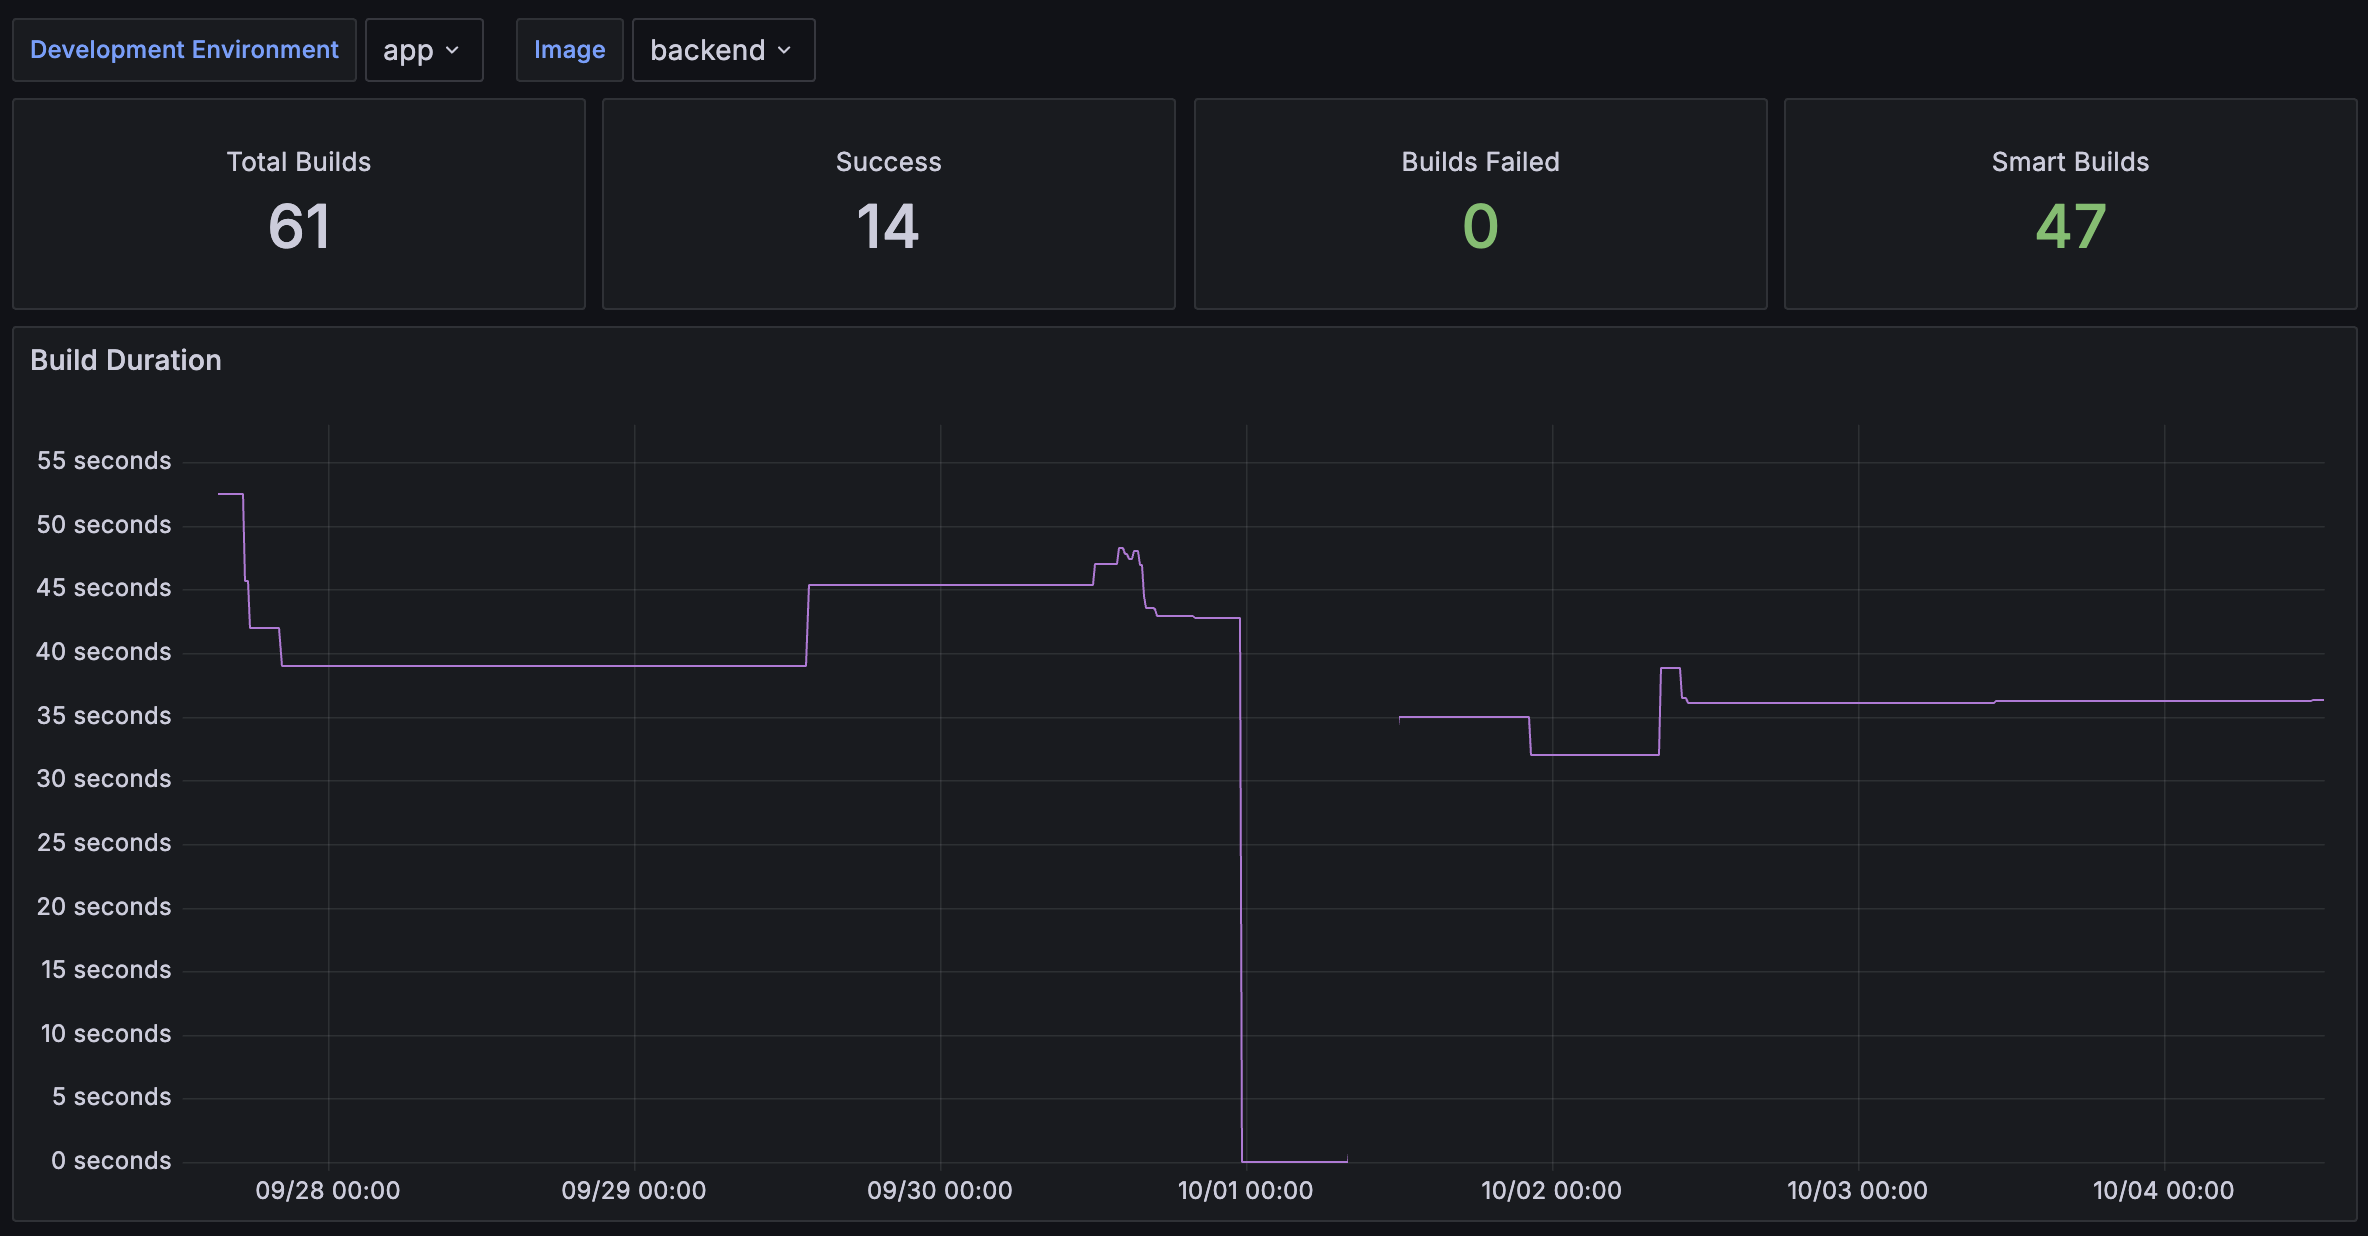
The Build dashboard helps you analyze the evolution of your image builds, focusing on both duration and error rates.
Variables
- Development Environment: The specific Okteto Development environment to display data for
- Image: Representing the name of image to display specific metrics for
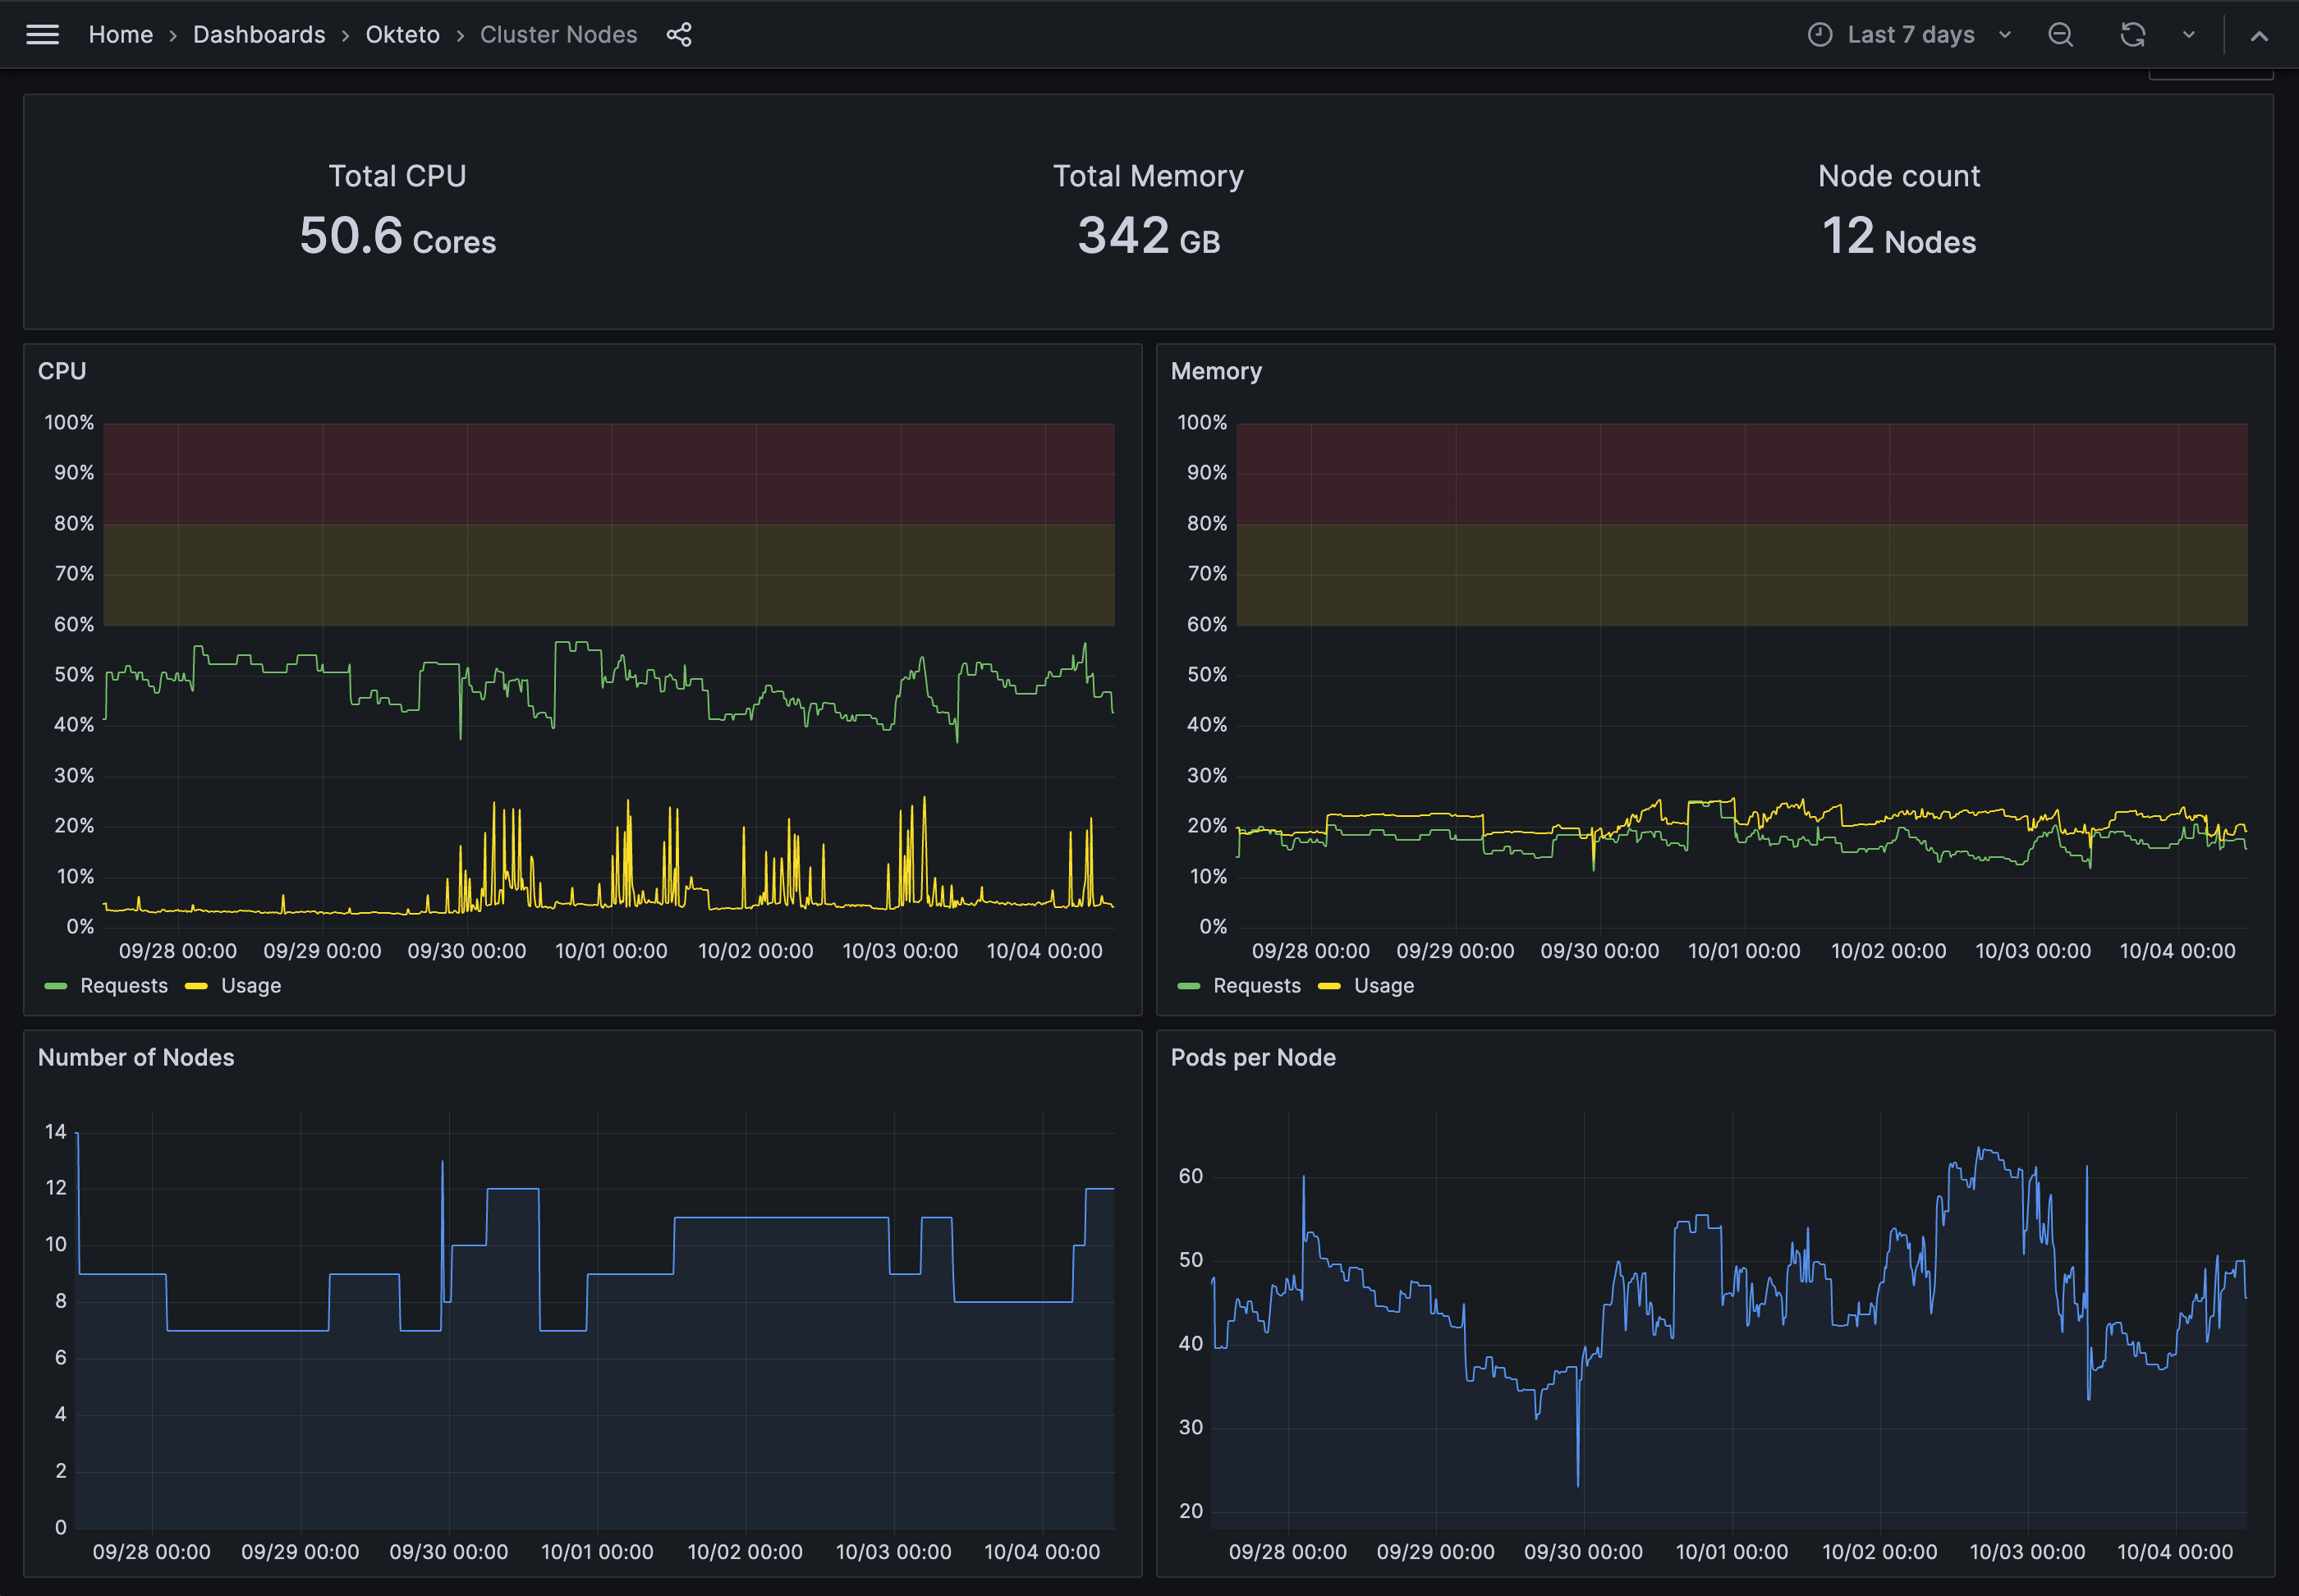
Cluster Nodes Dashboard
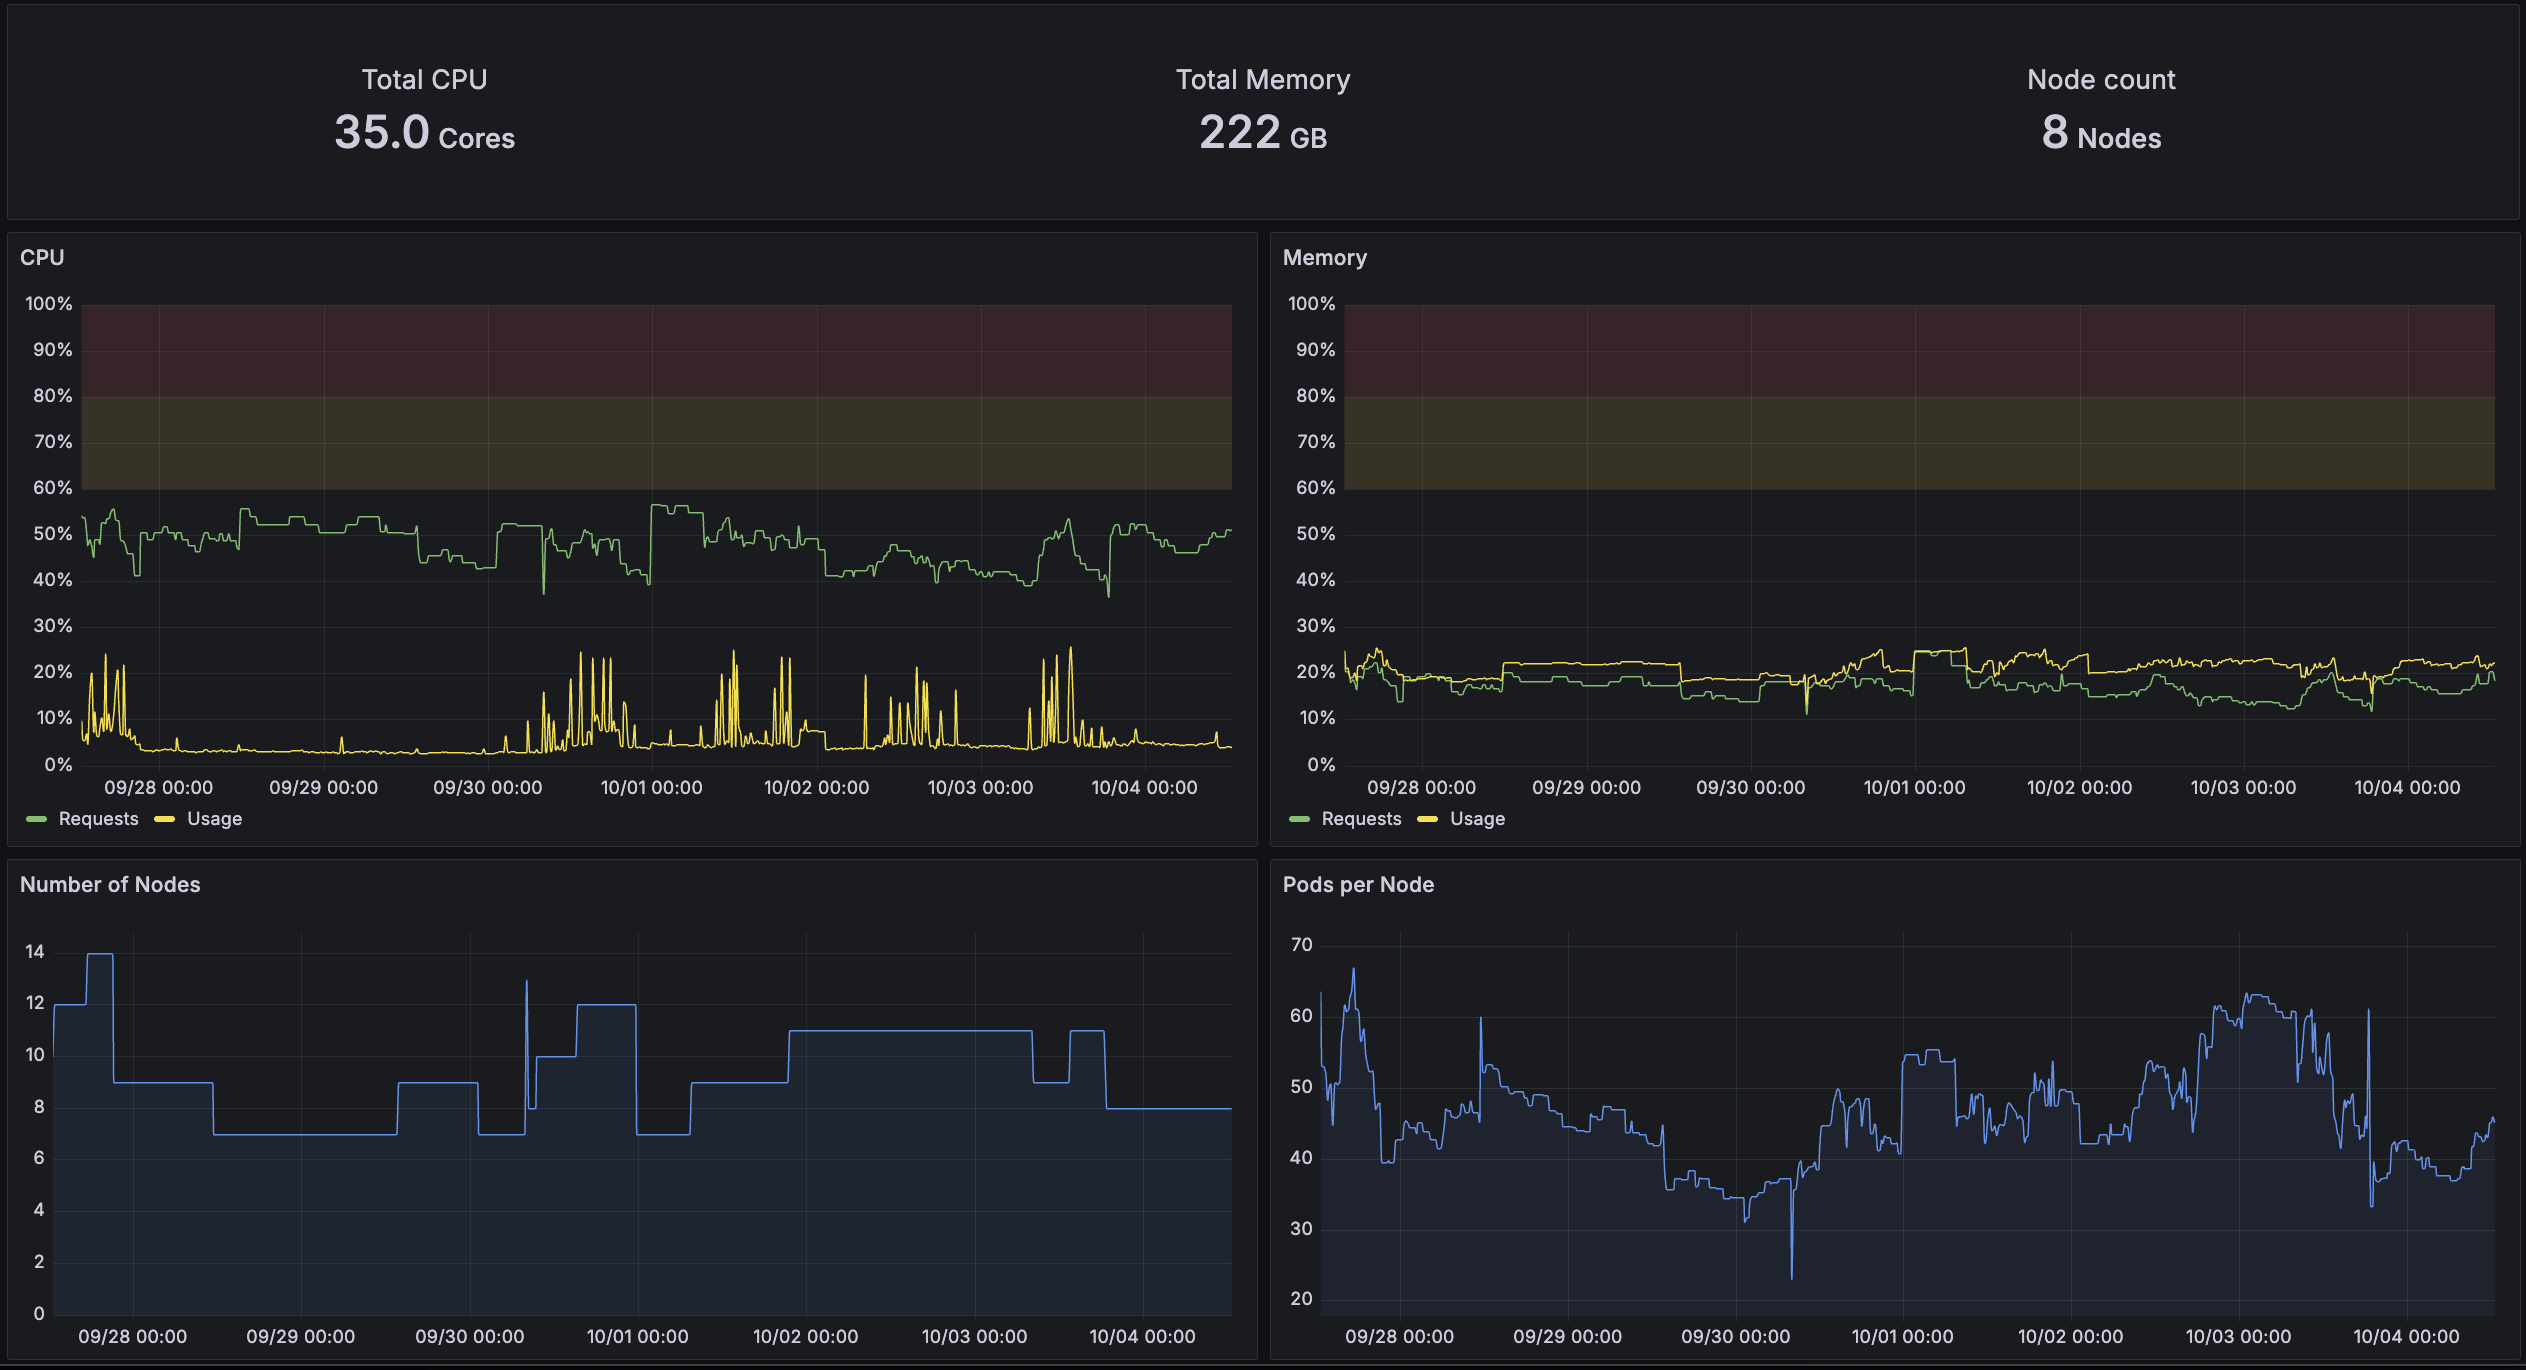
The Cluster Nodes dashboard provides a high-level overview of your cluster nodes' utilization, with a focus on CPU and memory usage. It helps you determine whether your cluster is over- or under-provisioned.
The Cluster Nodes dashboard also assists in evaluating if the CPU and memory requests of your pods align with actual usage. Pods under-utilizing their CPU/memory requests leads to wasted infrastructure, while Pods exceeding their CPU/memory requests can result in CPU throttling, pod evictions, or unbalanced workloads across the cluster.
Deploy Dashboard
The Deploy dashboard helps you analyze the evolution of application deployments, focusing on both duration and error rates.
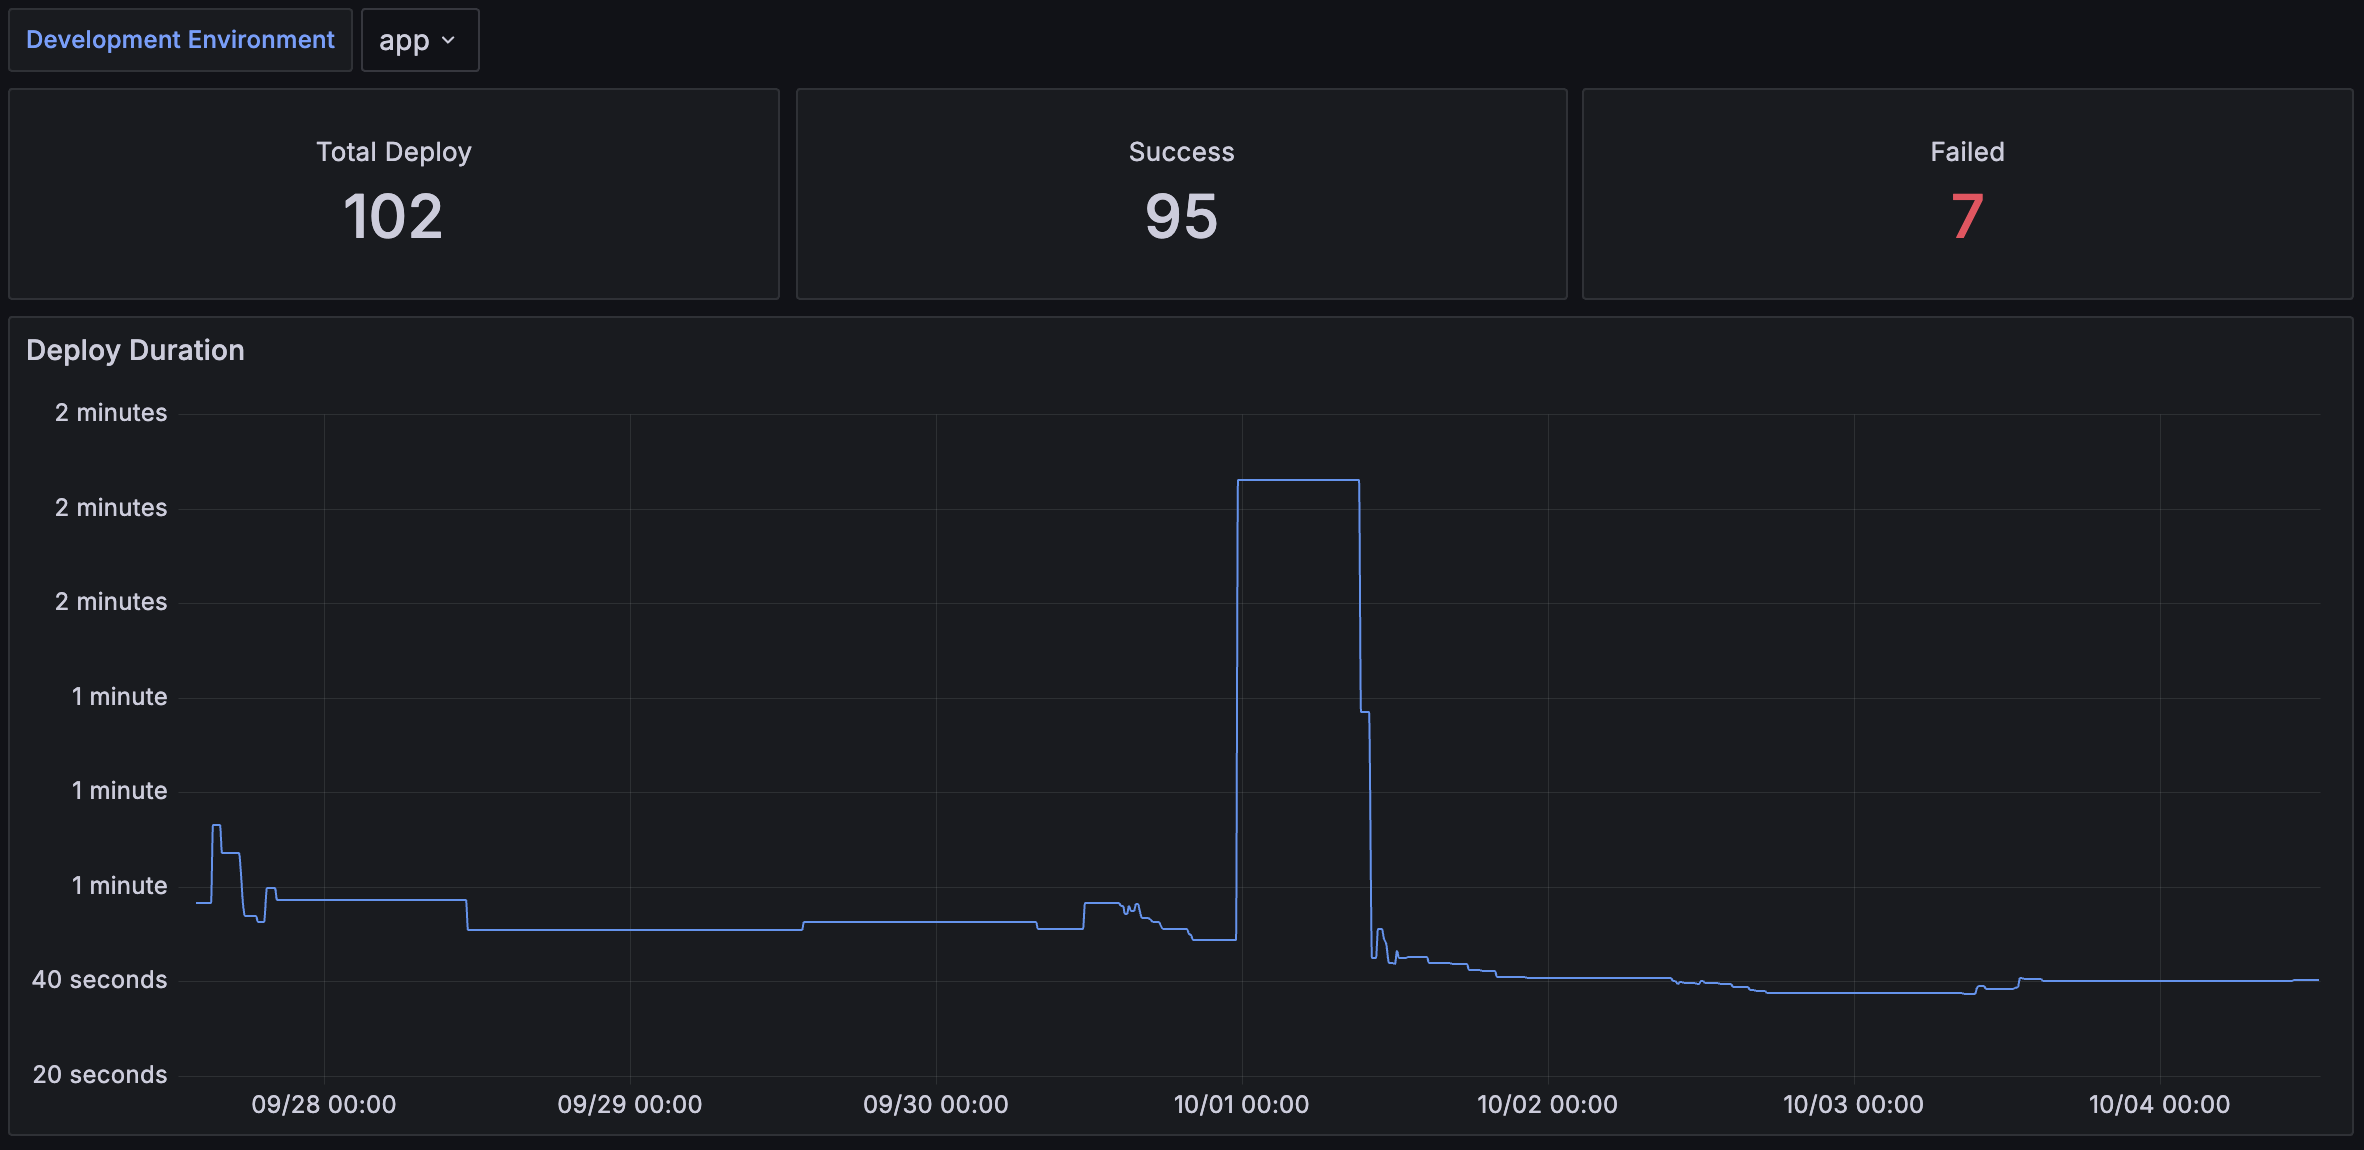
Variables
- Development Environment: The specific Okteto Development environment to display data for
Nodes Dashboard
The Nodes dashboard offers a high-level overview of each cluster node's utilization, focusing on CPU and memory usage. It helps troubleshoot performance issues on specific nodes and validate that your workloads are properly balanced across the cluster.
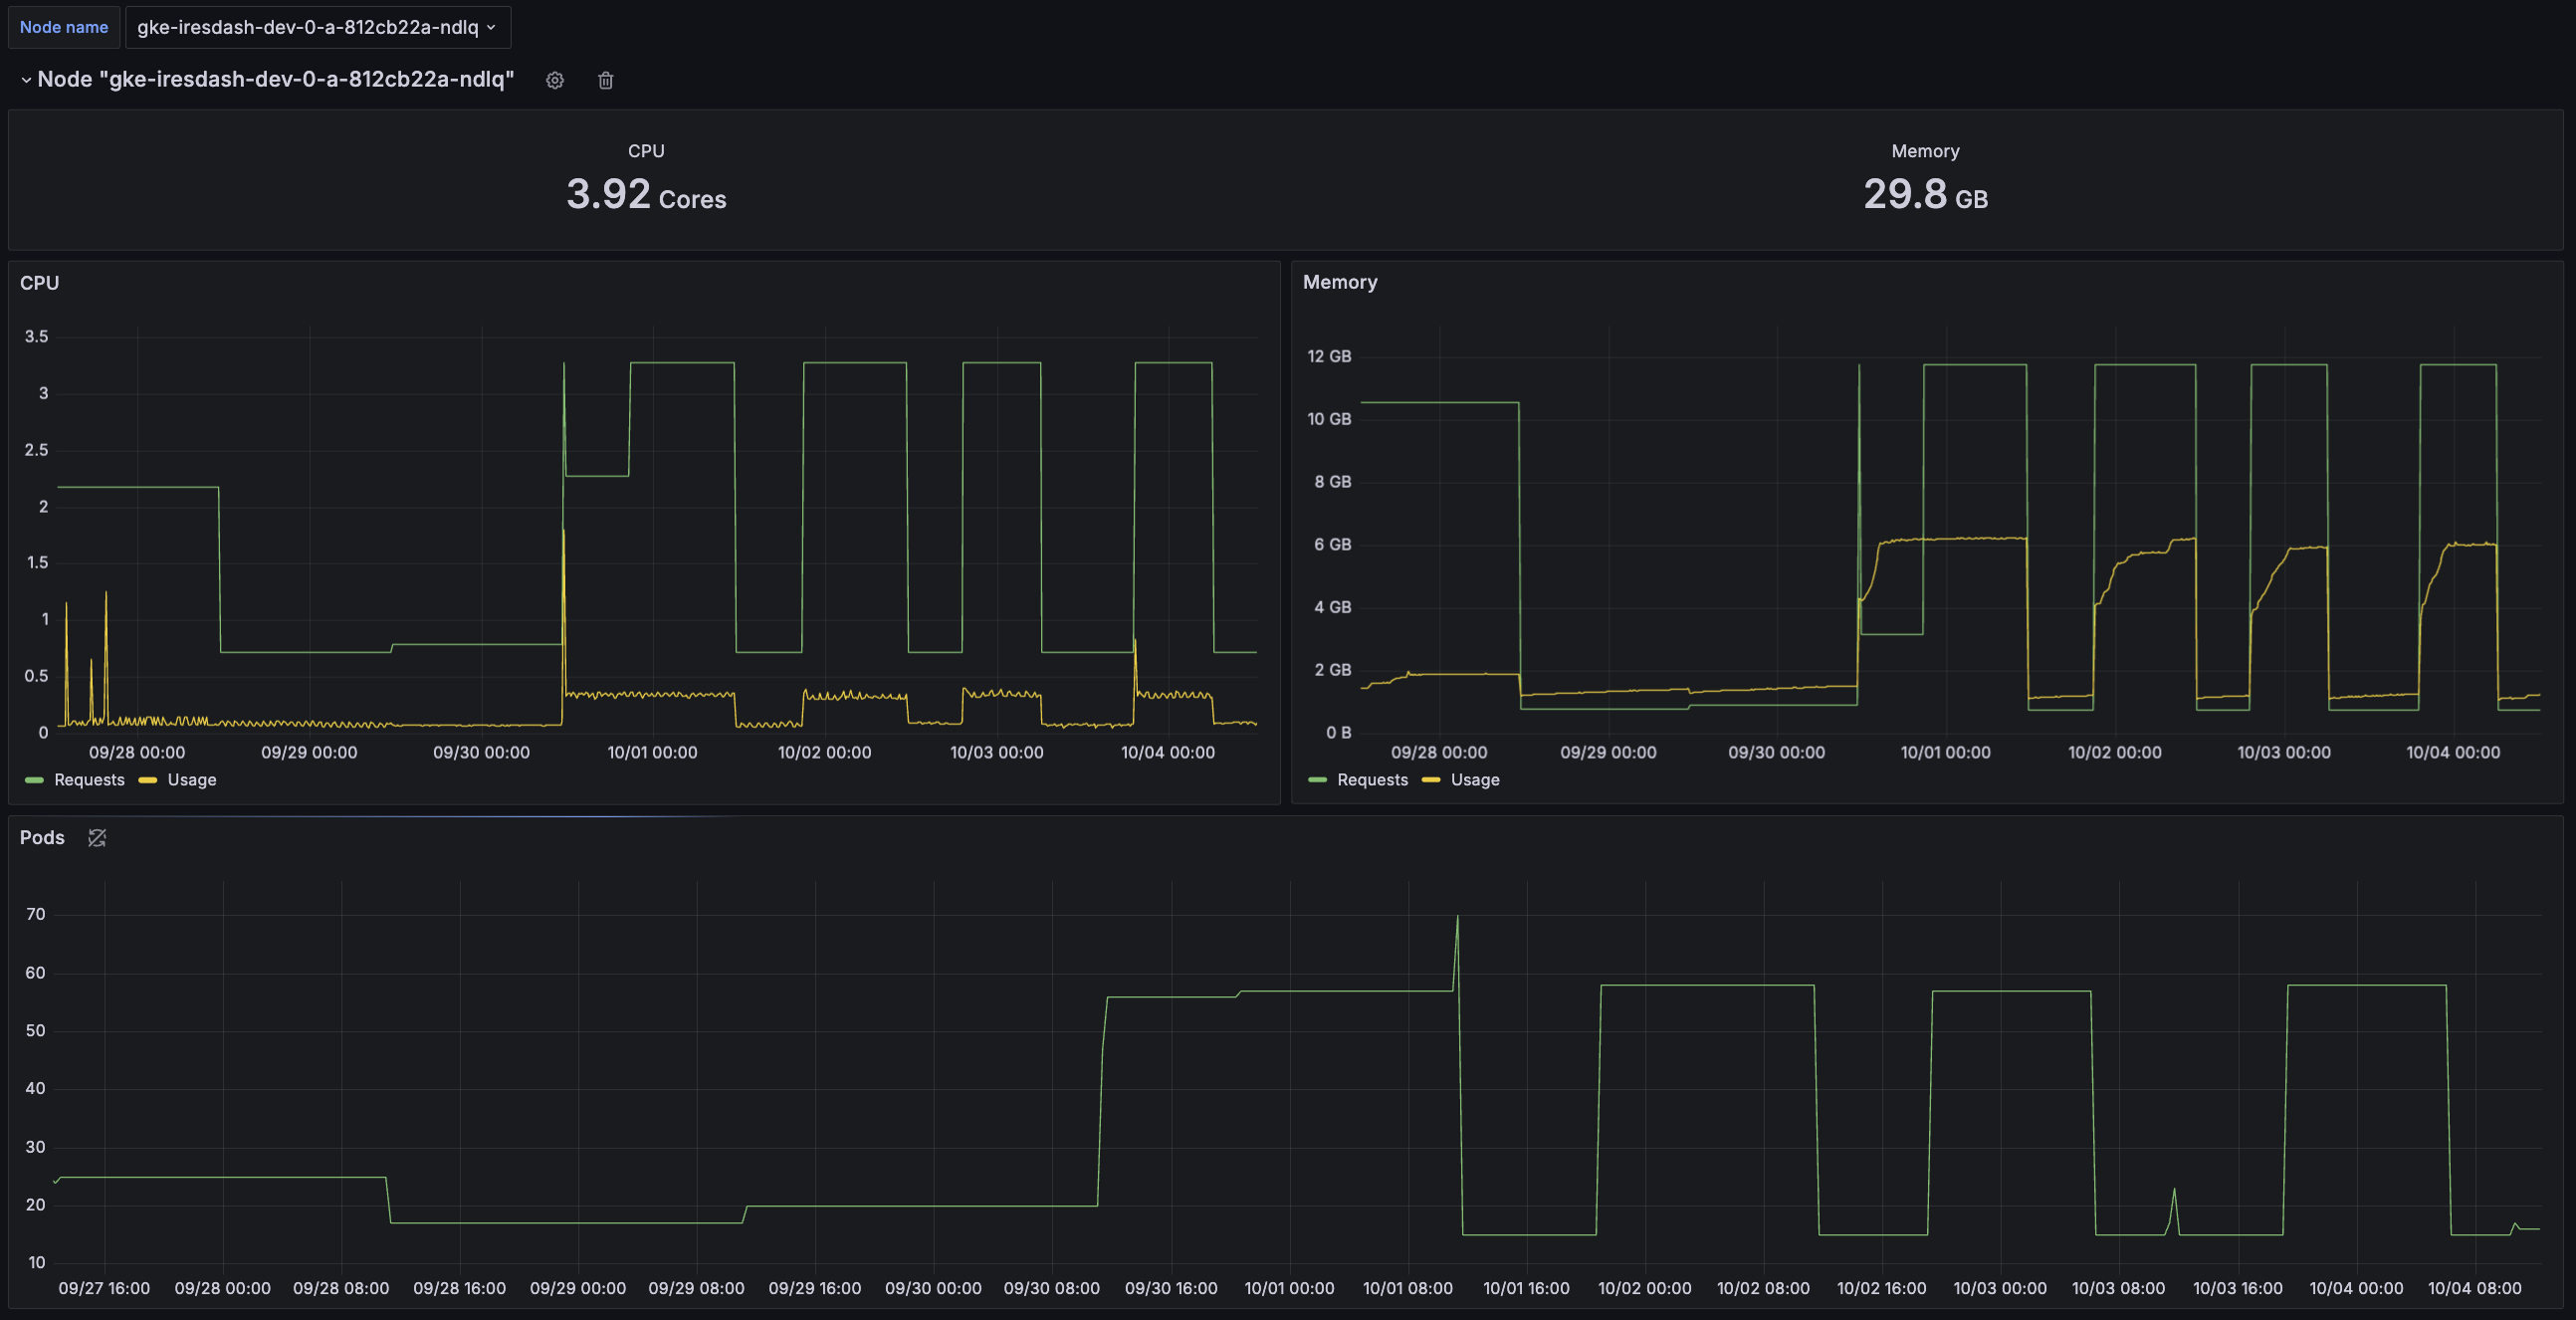
Variables
- Node Name: The name of the Kubernetes node to display specific data for
Pods Dashboard
The Pods dashboard shows usage information related to each Kubernetes Pod. It helps you to analyze the performance (memory leaks, CPU optimization, etc.) of the application code running in a particular namespace.

Variables
- Namespace: The name of the Okteto Namespace to display specific data for, filtered by the selected Development Environment
- Development Environment: The specific Okteto Development environment to display data for.
Consuming Insights metrics from other tools
View our Okteto Insights Admin Documentation to see all metrics behind the dashboards.
If you're interested in the calculations behind these dashboards, we've open-sourced them based on the Okteto Insights data made available through our scrape endpoint.